

This article provides an analysis of the July 2025 U.S. Consumer Price Index (CPI) inflation data, as well as leasing and sales activity across major areas in the Austin-Round Rock-San Marcos Metropolitan Statistical Area (MSA).
Data Note: All housing market charts cited in this article are sourced from Unlock MLS. Due to slight differences in reporting periods and geographic coverage, minor discrepancies in numbers may exist. Please focus on overall trends and market structure when interpreting these signals.
July CPI Update: Inflation Sets the Stage
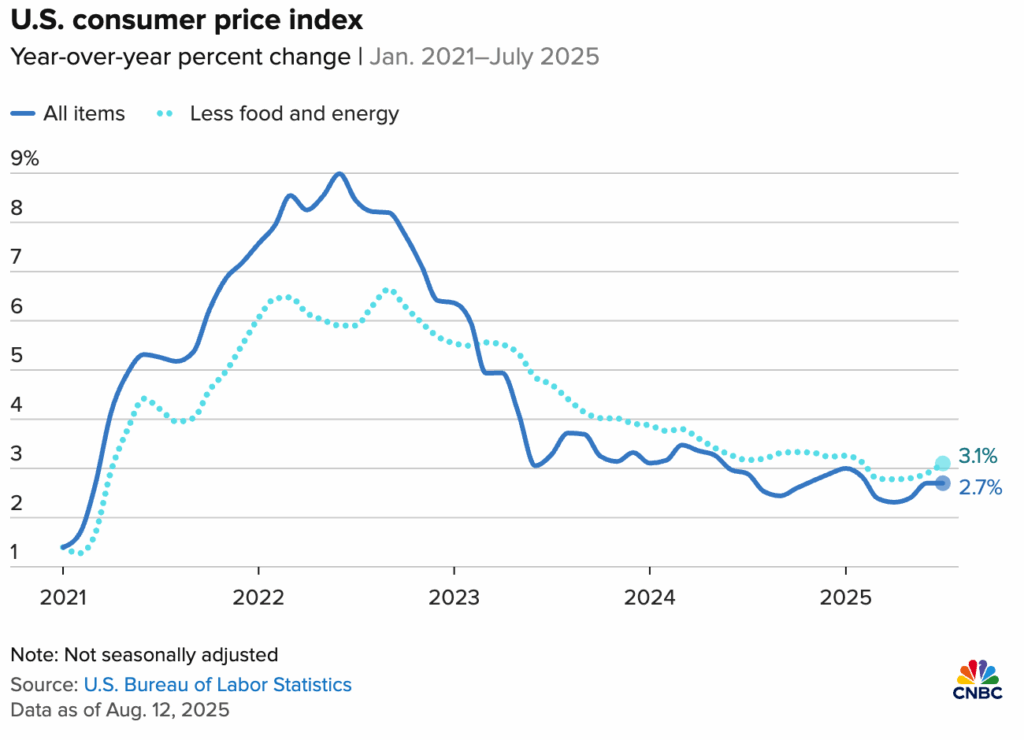
The July Consumer Price Index (CPI) came in softer than expected, with headline inflation up 2.7% year-over-year and core CPI (excluding food and energy) up 3.1%. The report confirms that overall price growth is moderating, though categories like housing and services remain stubbornly high.
This softer reading boosted expectations that the Fed will cut interest rates in September, with CME’s FedWatch tool now showing a probability between 88% and 92%. Markets are also pricing in about a 50% to 60% chance of another cut in October.
Austin Housing Market in July: Softer Prices, Stronger Supply
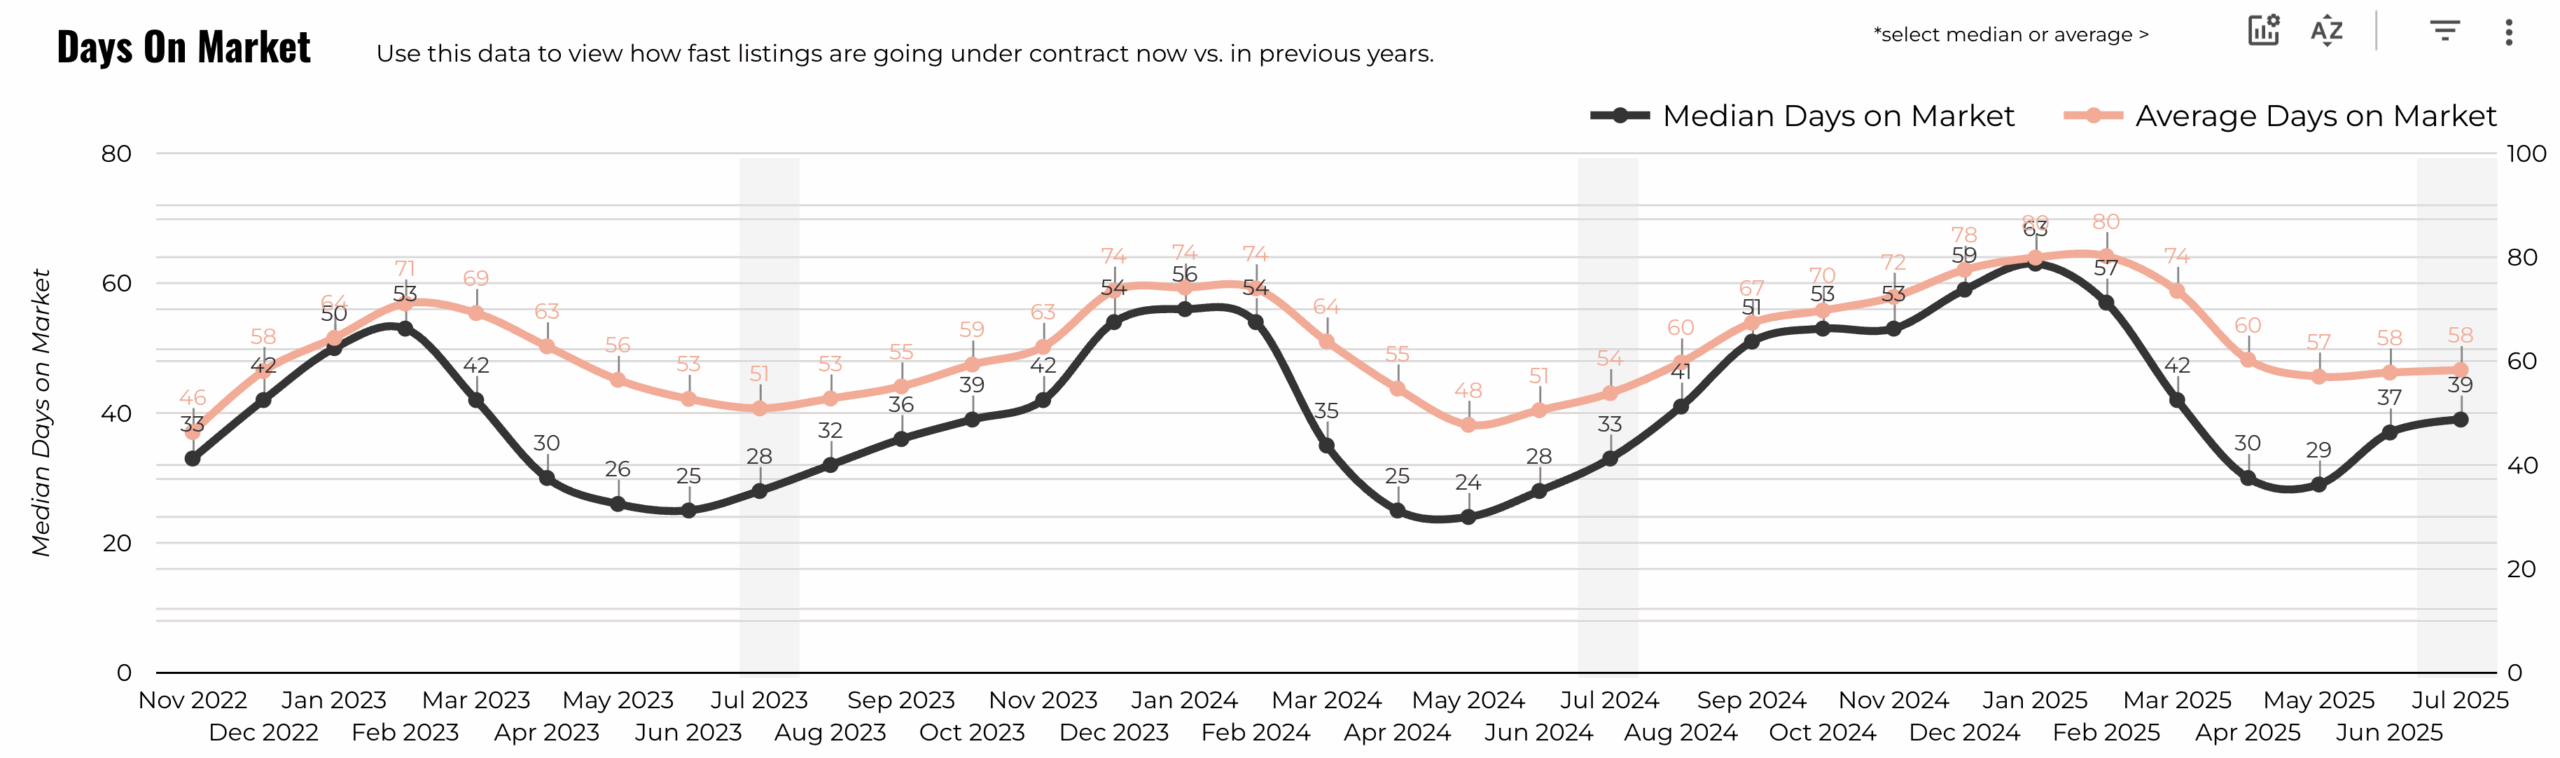
According to Unlock MLS data, the Days on market stretched to 39 days, two days longer than June. Even so, new under contracts were strong: 2,543 homes went under contract in July, a year-over-year increase. This is a healthy sign, especially as the market transitions into the late-summer and holiday slowdown.
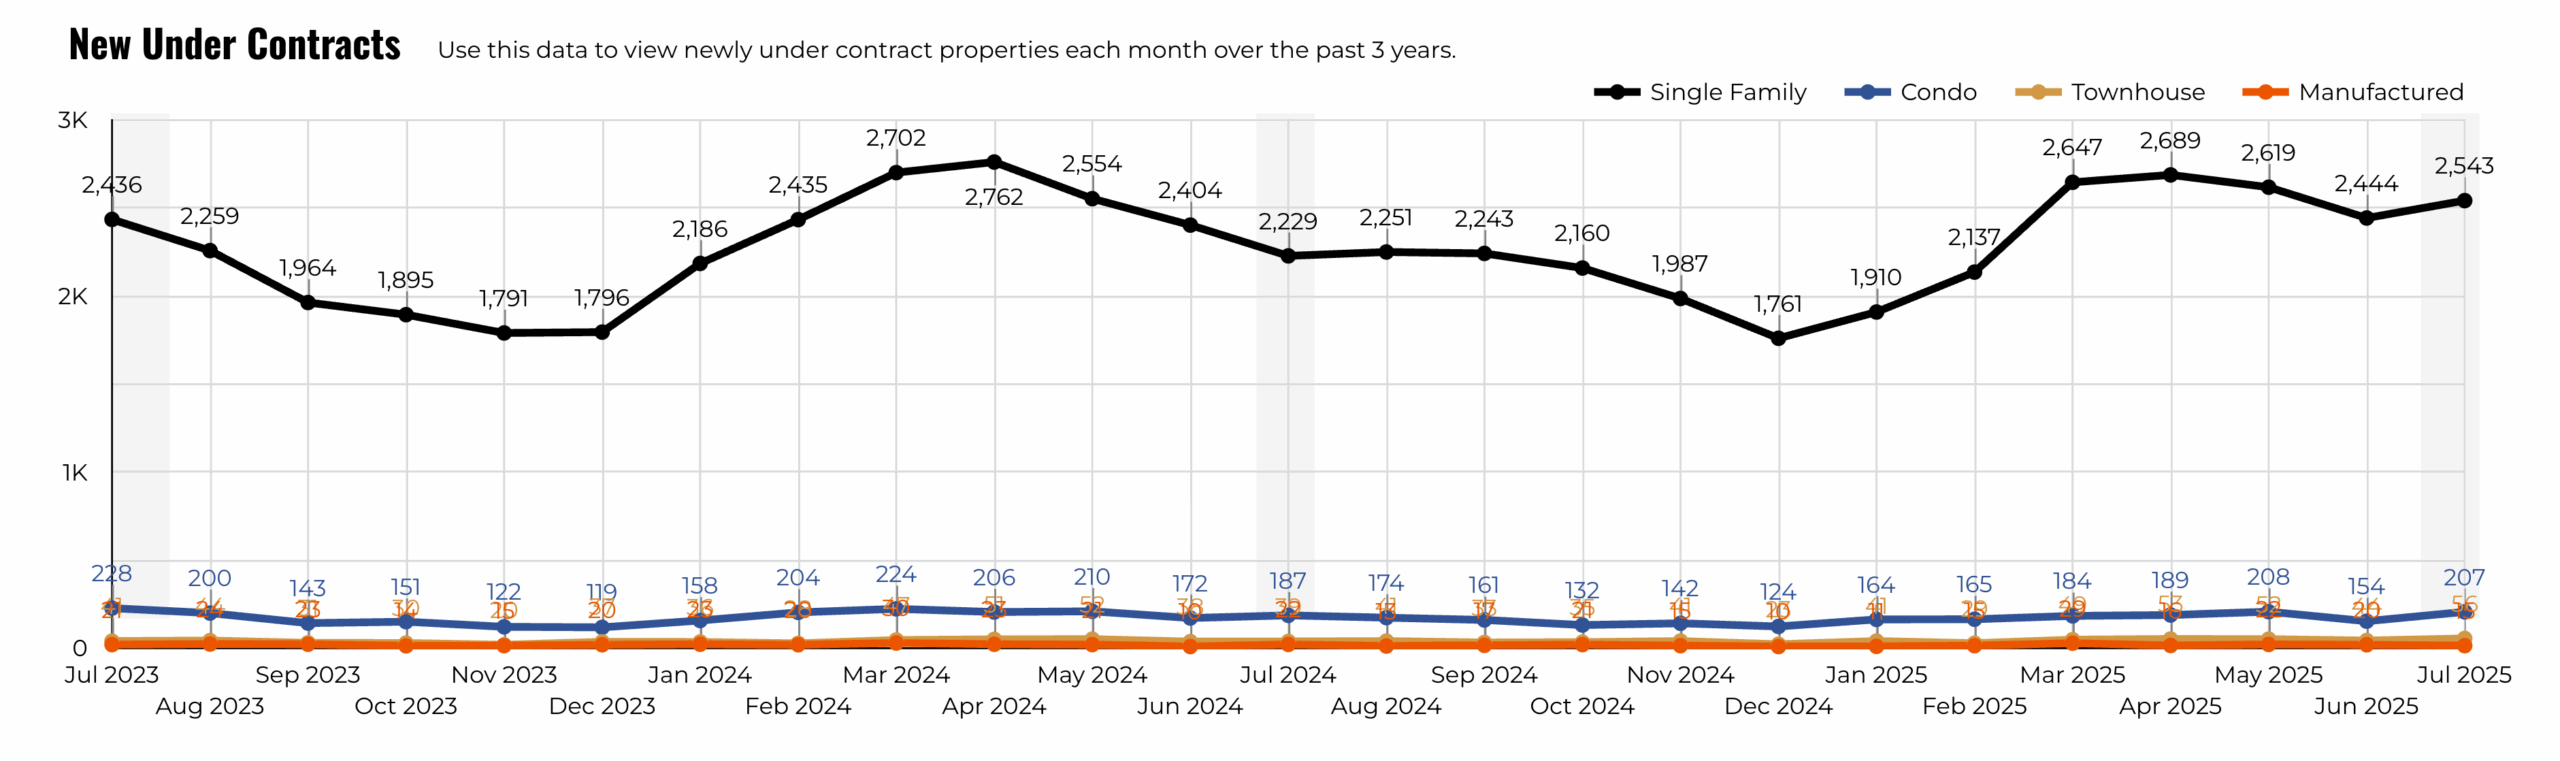
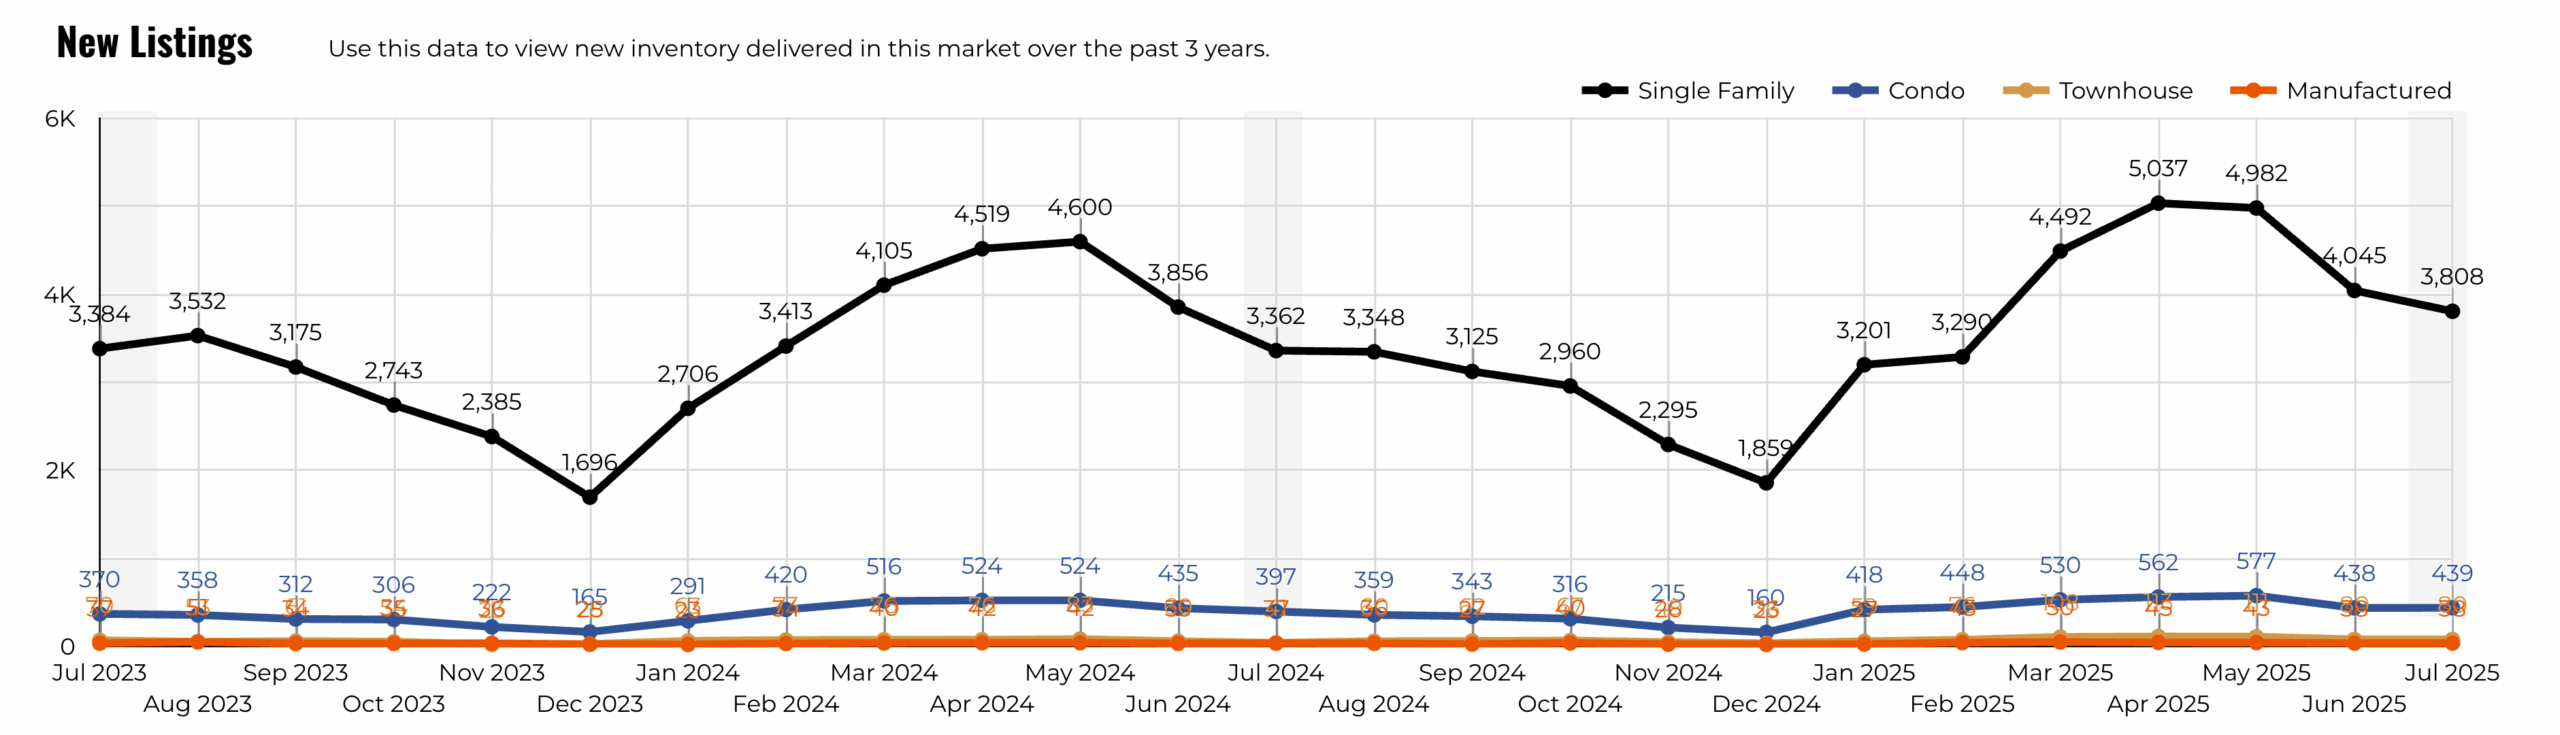
New listings totaled about 4,400 units across the Austin metro, slightly fewer than June, but still high compared with last year, up 13.6%. Single-family homes remain the dominant share, accounting for more than 90% of activity.
Market Summary
July data paints a picture of slowing transactions, stable prices, and climbing inventory. Much of this can be attributed to seasonal cooling as summer winds down and families focus on travel.
Compared with prior years, however, inventory levels are clearly higher, firmly positioning the metro as a buyer’s market. Buyers now enjoy more choice and greater bargaining power, while sellers who need to transact should focus on competitive pricing strategies.
Looking ahead, if interest rates do decline in the fall, both buyers and sellers could return to the market more actively, setting up for a livelier start to 2026.
County-Level Market Highlights
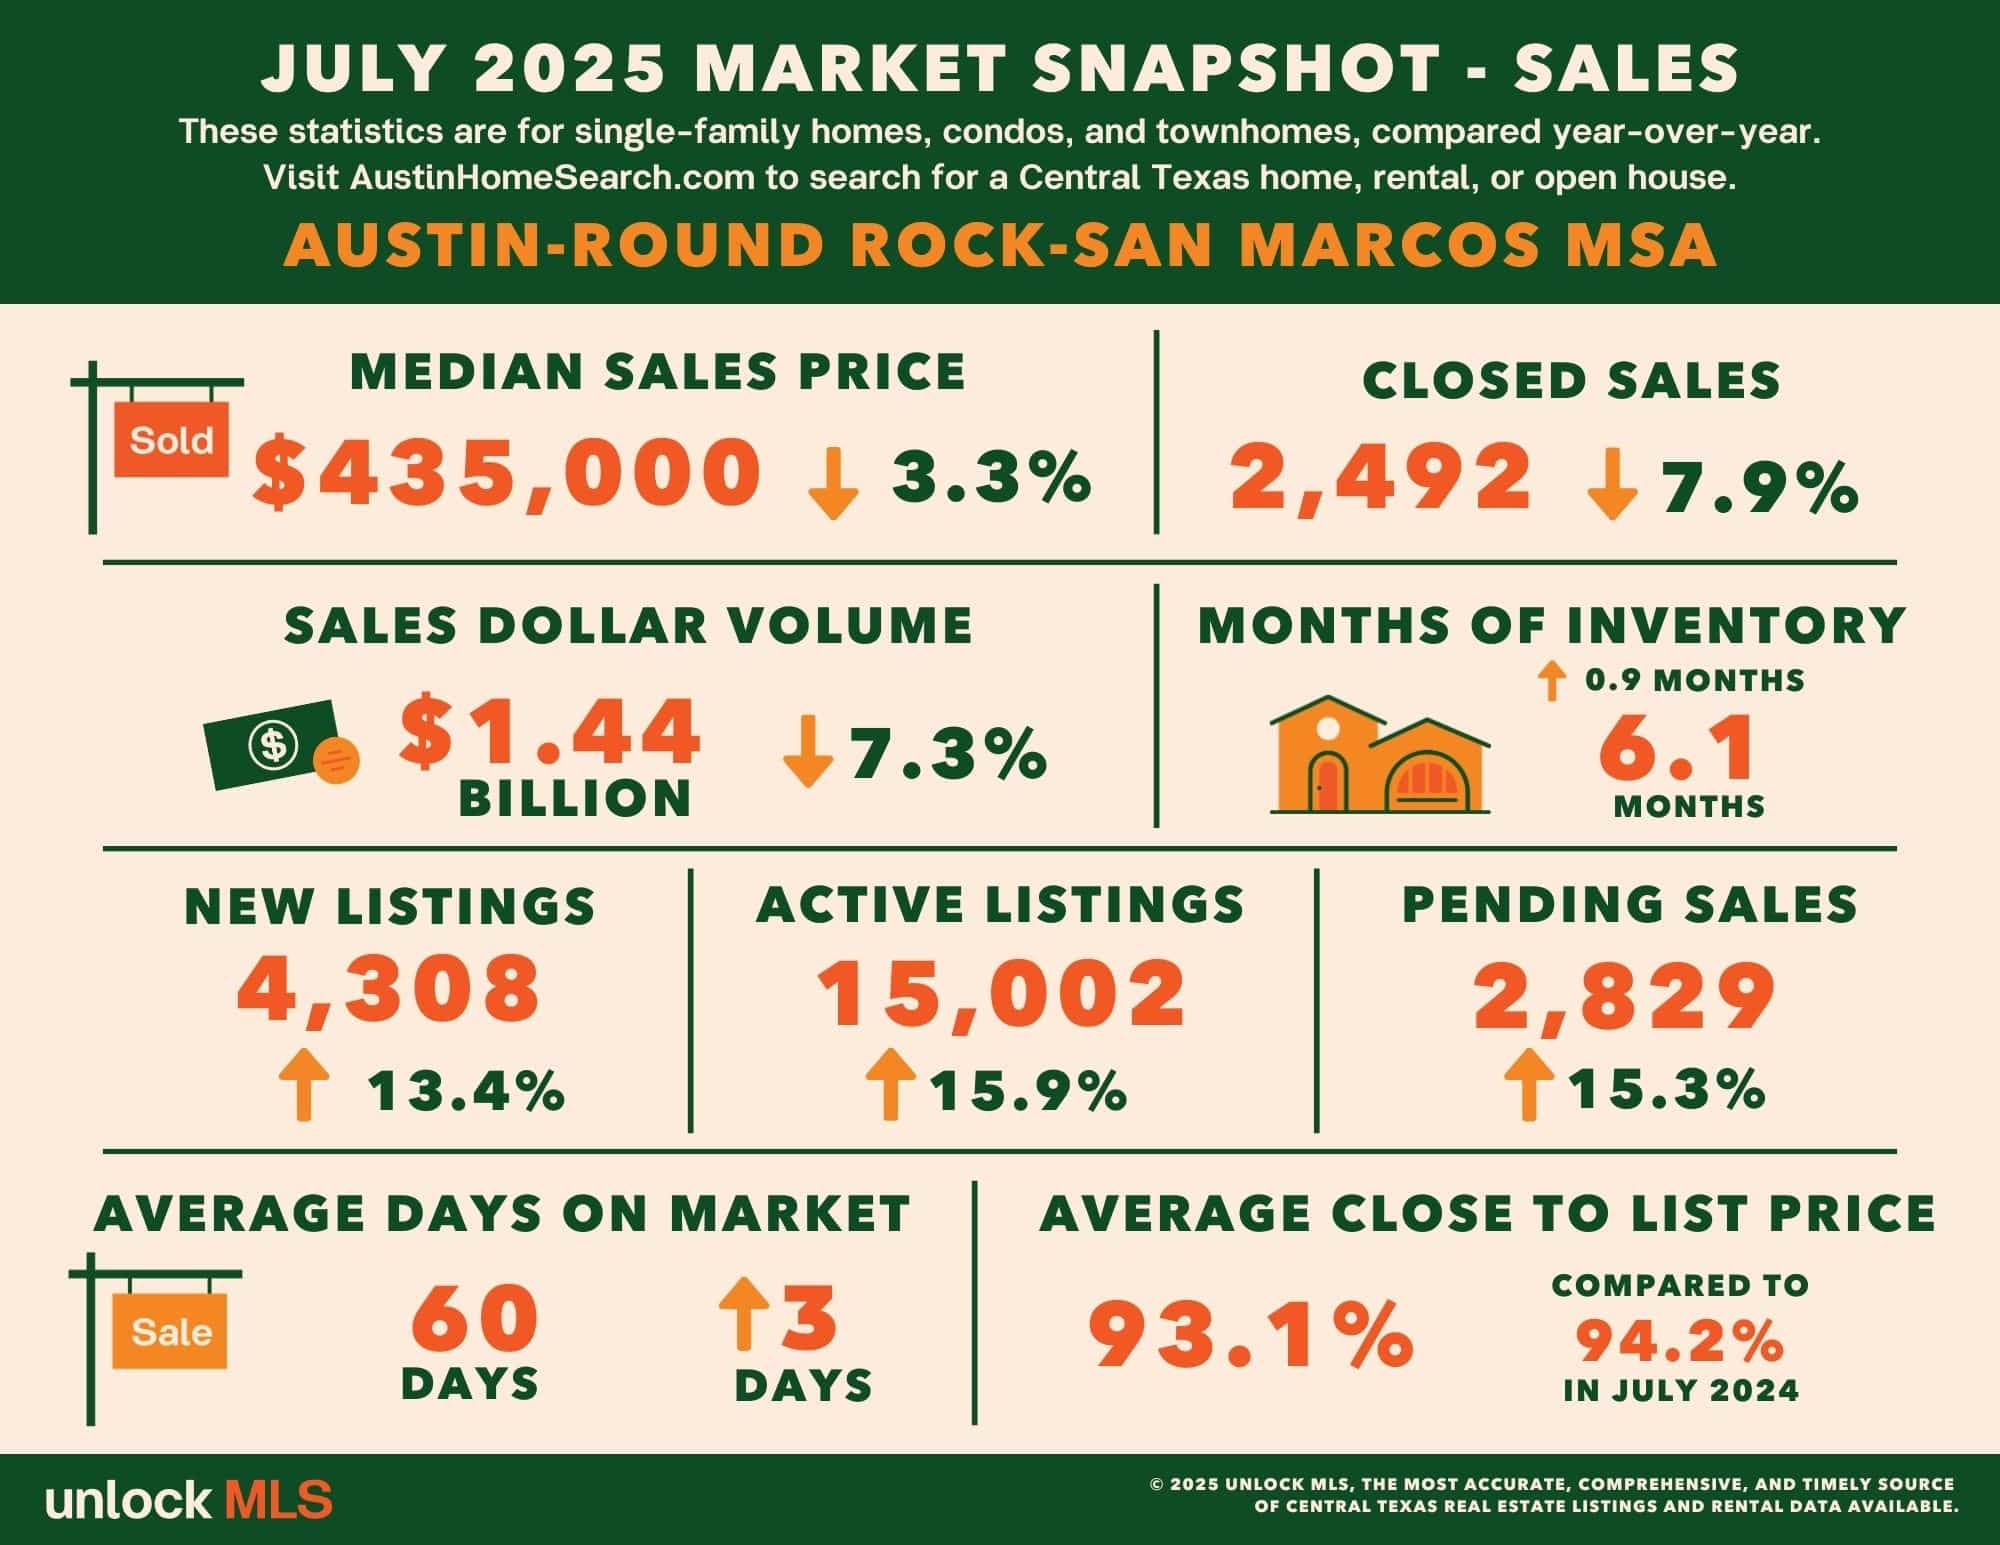
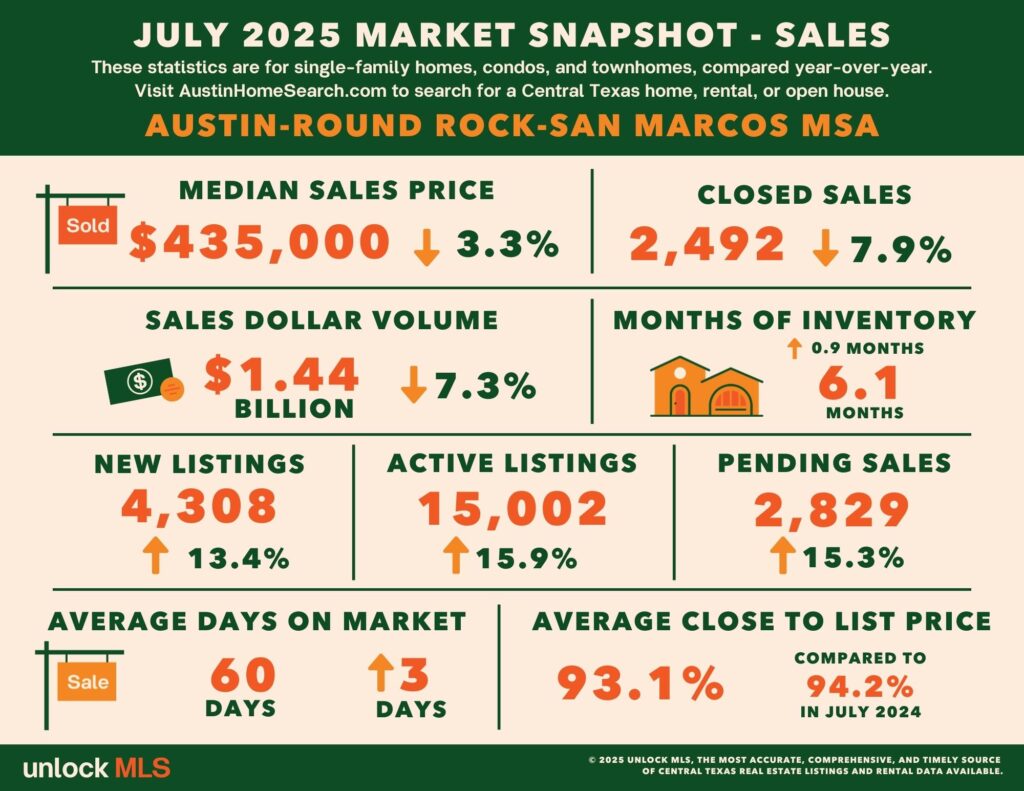
Beneath the metro-wide trends, July’s numbers further confirmed a buyer’s market. The median home price slipped to $435,000 as overall sales volume fell 7.3% year-over-year, but pending sales surged 15.3%, showing that buyers are stepping in as inventory expands.
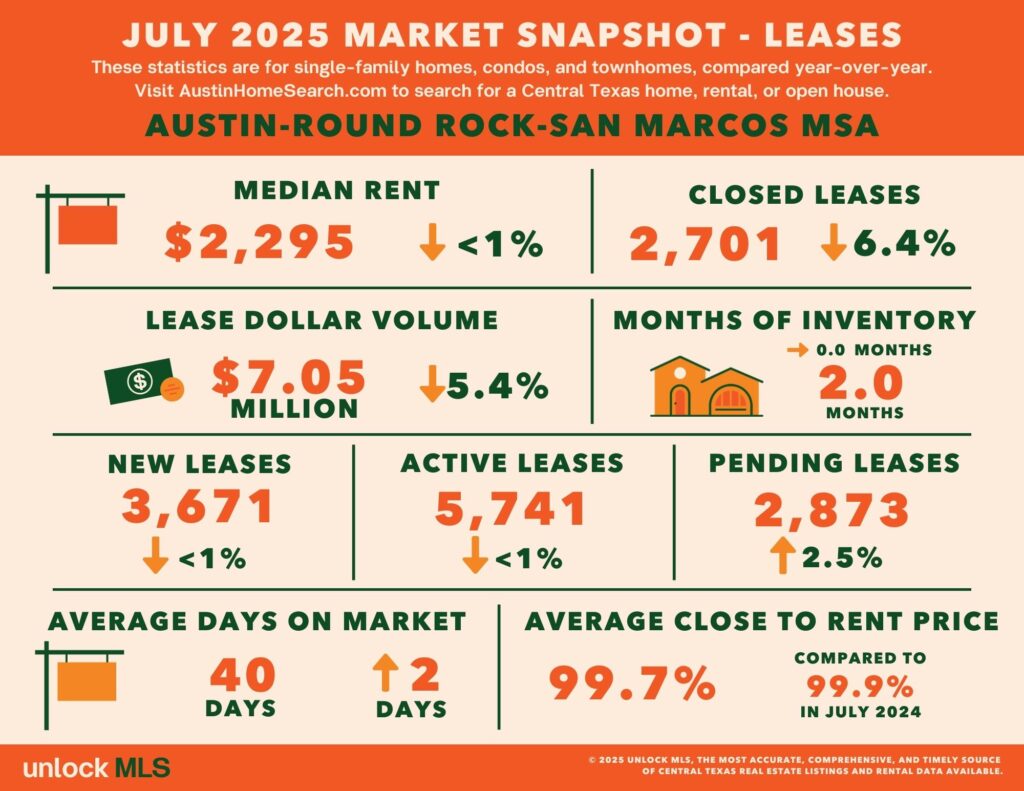
On the rental side, the median rent held near $2,295, while pending leases rose modestly to 2,873, a sign that tenant demand remains resilient even as leasing cycles lengthen.
👉 Below is a closer look at how each county across the Austin-Round Rock metro performed in July.
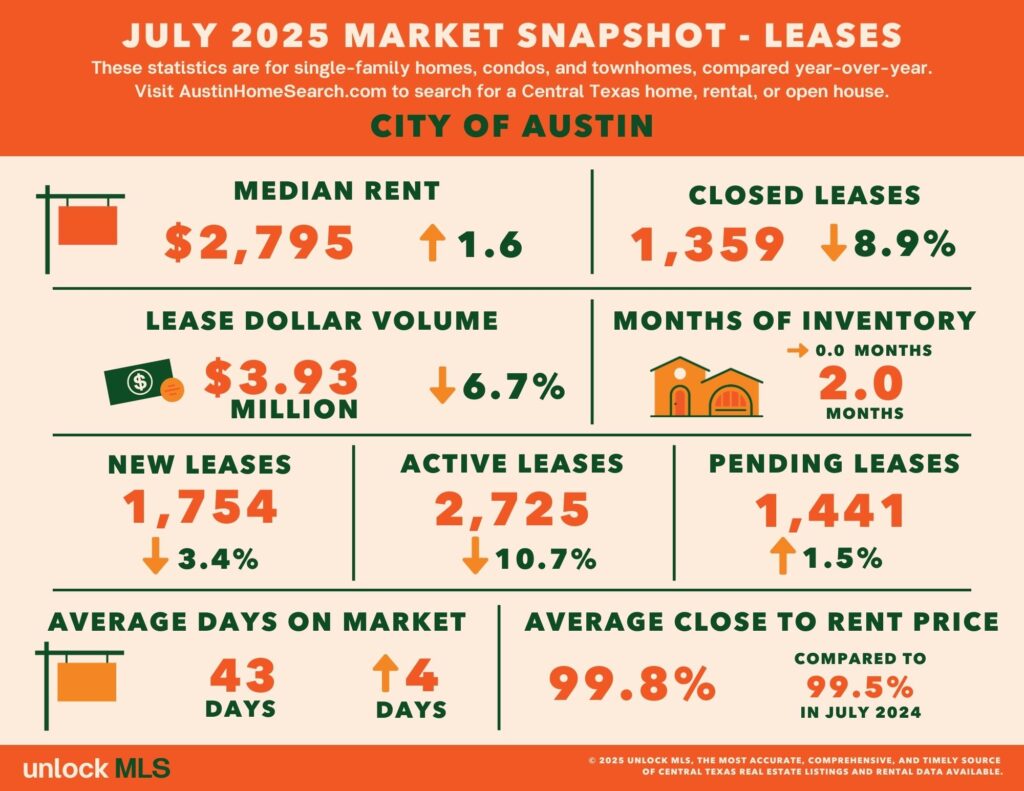
City of Austin
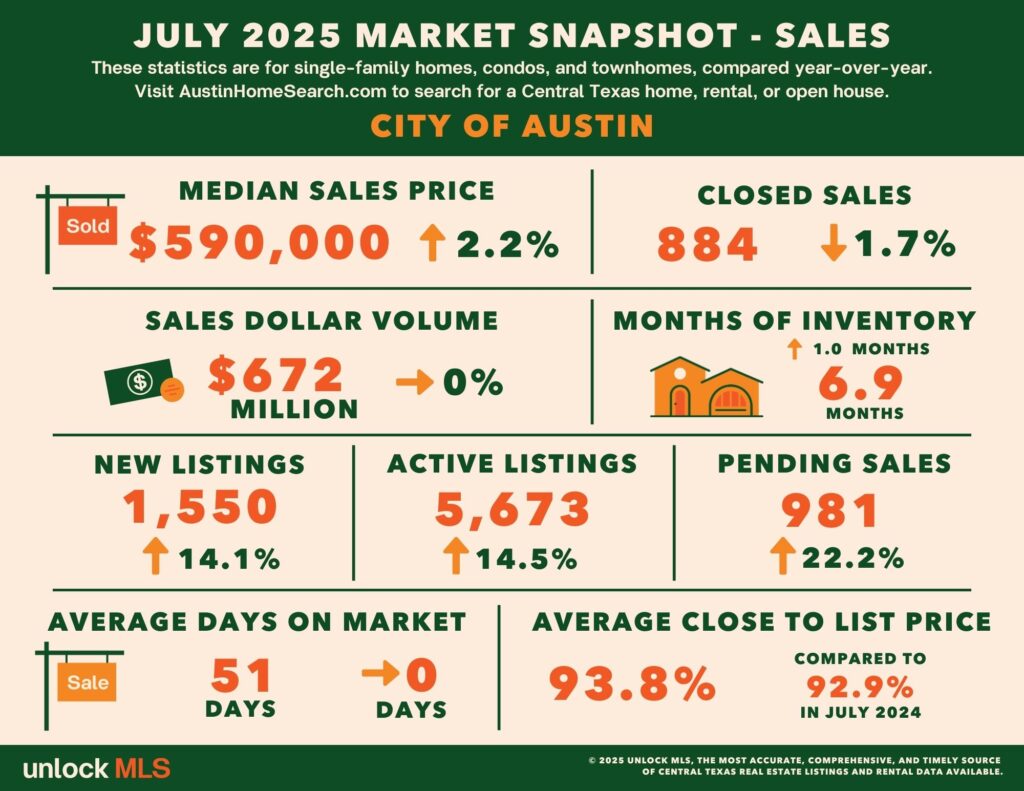
With the median sales price up 2.2% year-over-year to $590,000, overall closings slipped 1.7%, while pending sales surged 22.2%, showing that buyer demand remains strong even as completed transactions lag.
Median rent in the city rose slightly to $2,795, but closed leases dropped nearly 9%, with longer leasing times pointing to a softer pace.
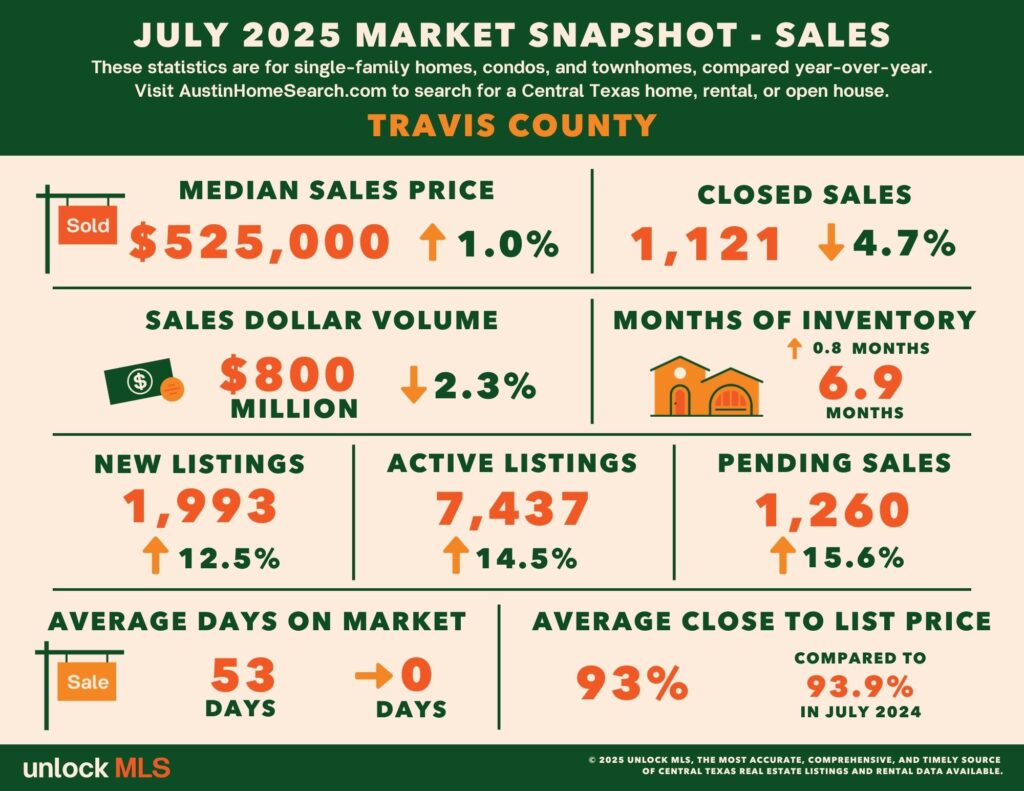
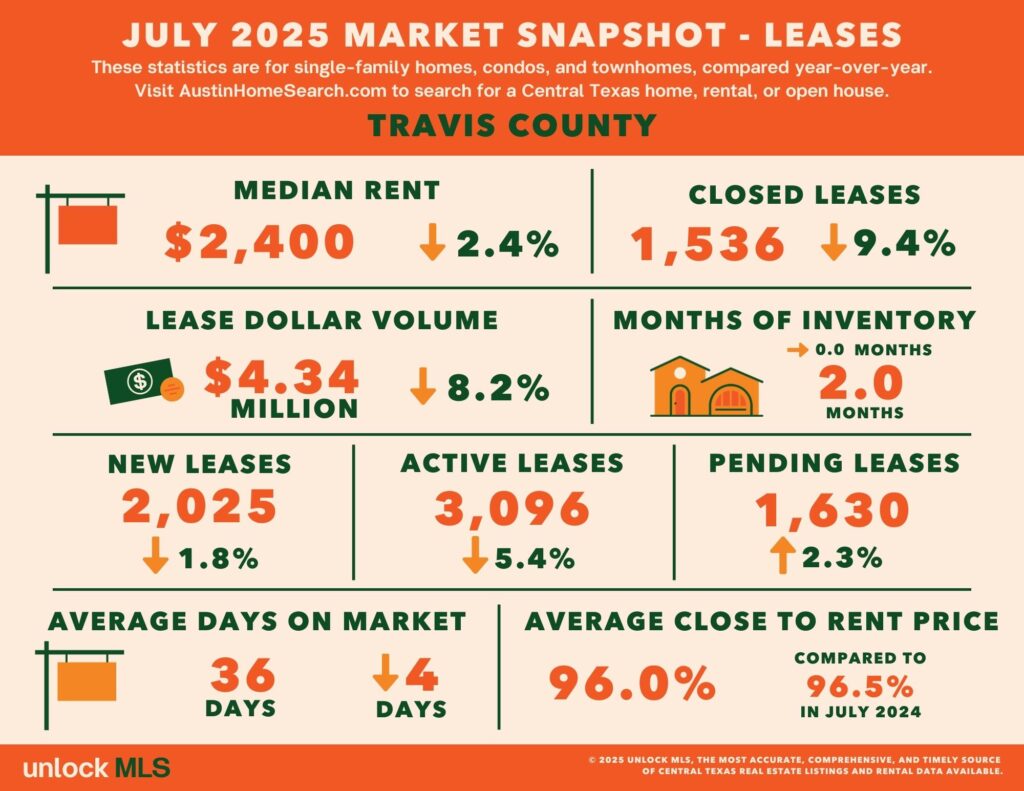
Travis County
Travis County’s median sales price rose 1% to $525,000 while total volume slipped 2.3%, but pending contracts rose 15.6%, pointing to resilient buyer interest. Inventory expanded sharply, with active listings up 14.5% and months of supply reaching 6.9.
In rentals, the median rent dropped 2.4% to $2,400, and signed leases fell, though pending leases edged higher by 2.3%. Still, pending leases edged higher, and faster leasing cycles show demand remains steady when the right units hit the market.
Williamson County
In Williamson County, the median sales price slipped 1.6% to $419,995. Listings surged 25.3%, creating broader supply even as closed sales fell 11.1%. However, pending sales increased 12.2%, reflecting renewed buyer engagement despite higher inventory. Rental demand was mixed, with fewer leases signed but a modest pickup in pending activity.


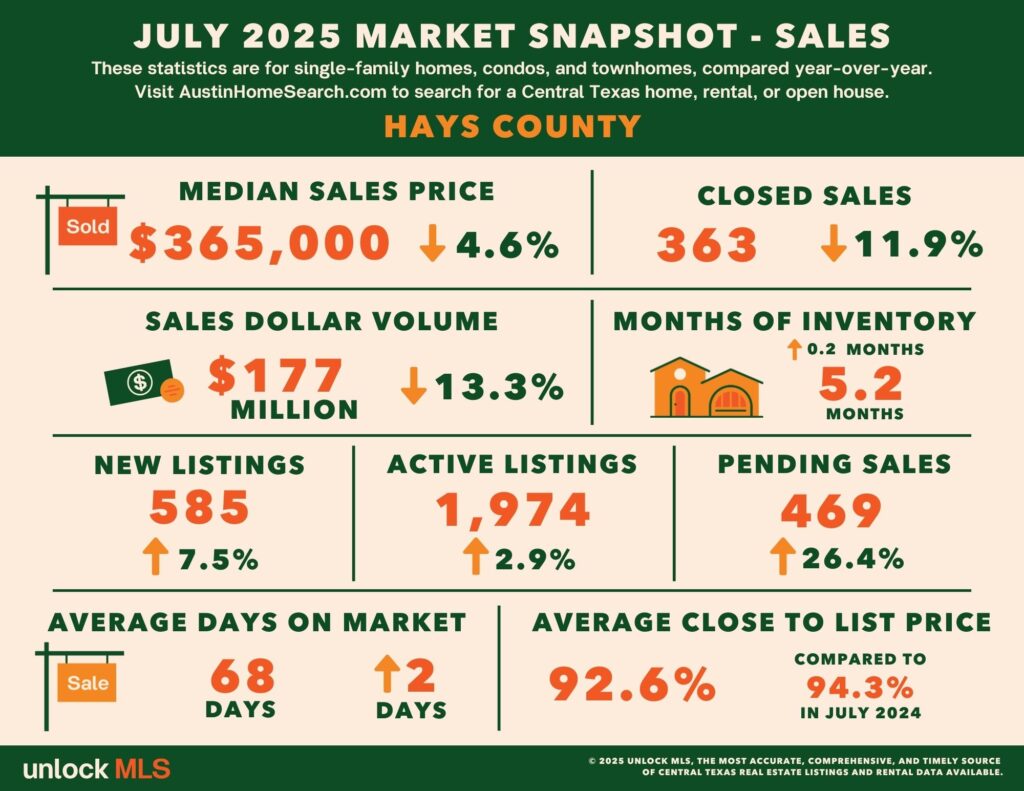
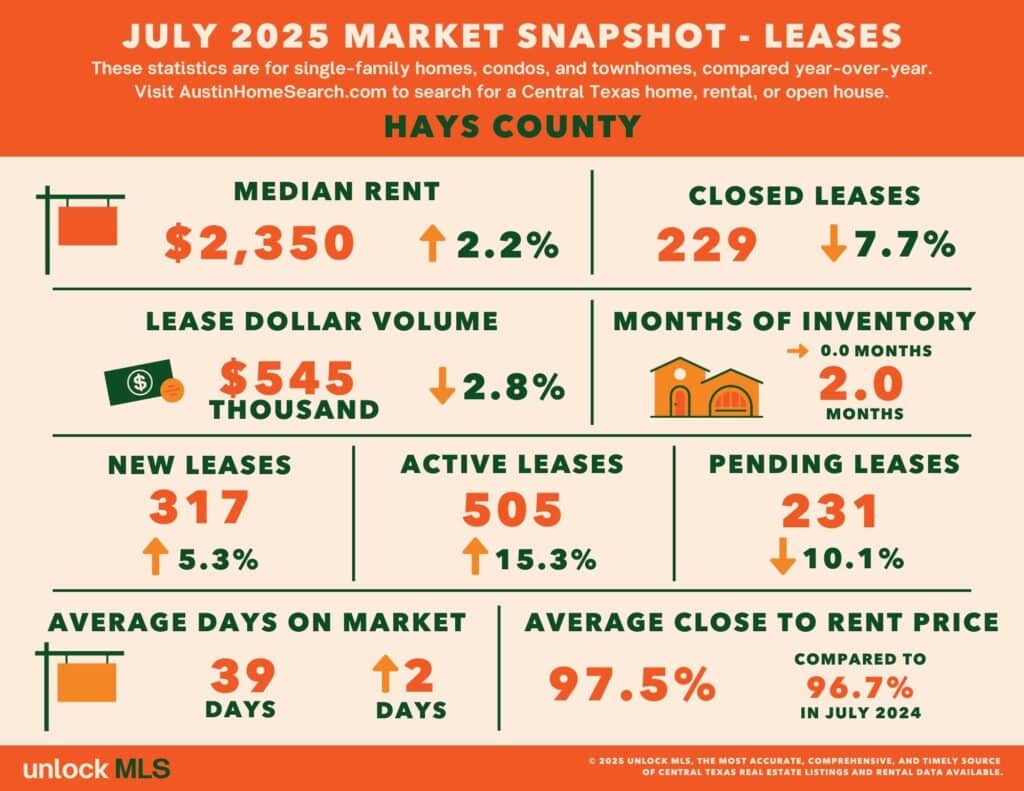
Hays County
Hays County saw its median sales price fall 4.6% to $365,000, while closed sales declined 11.9%. Yet pending contracts surged 26.4%, signaling that buyers are beginning to take advantage of softer prices. Rentals told the opposite story: rents edged higher, but lease activity weakened, reflecting tenants pulling back in the face of more supply.
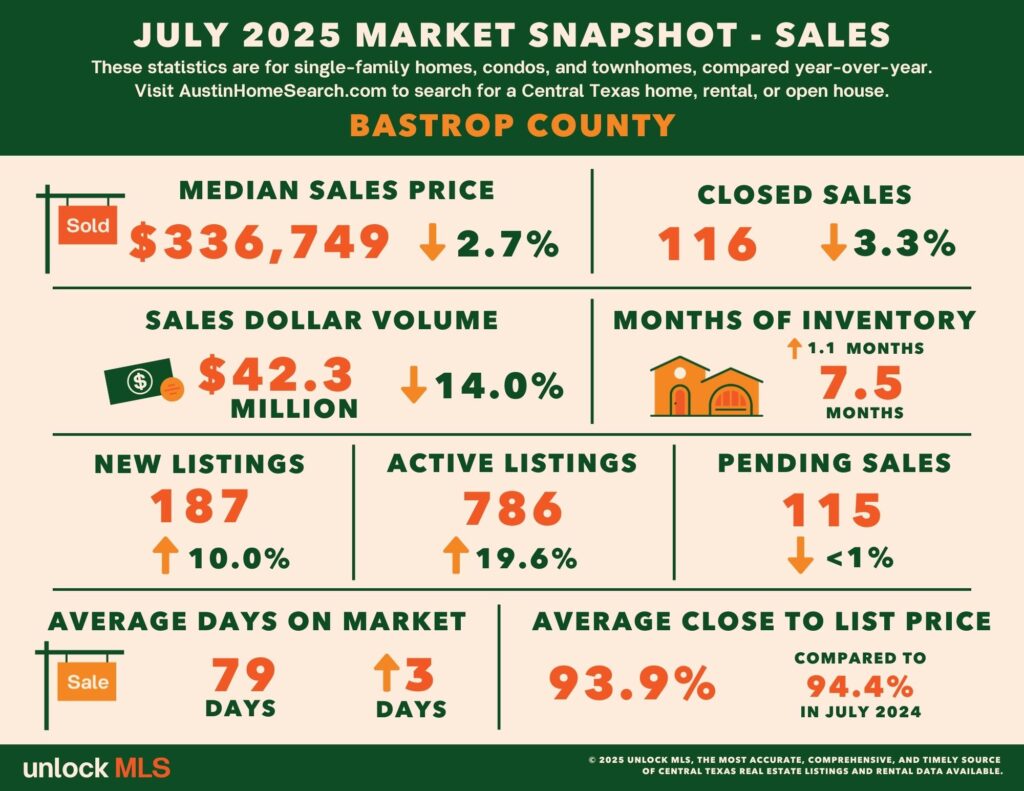
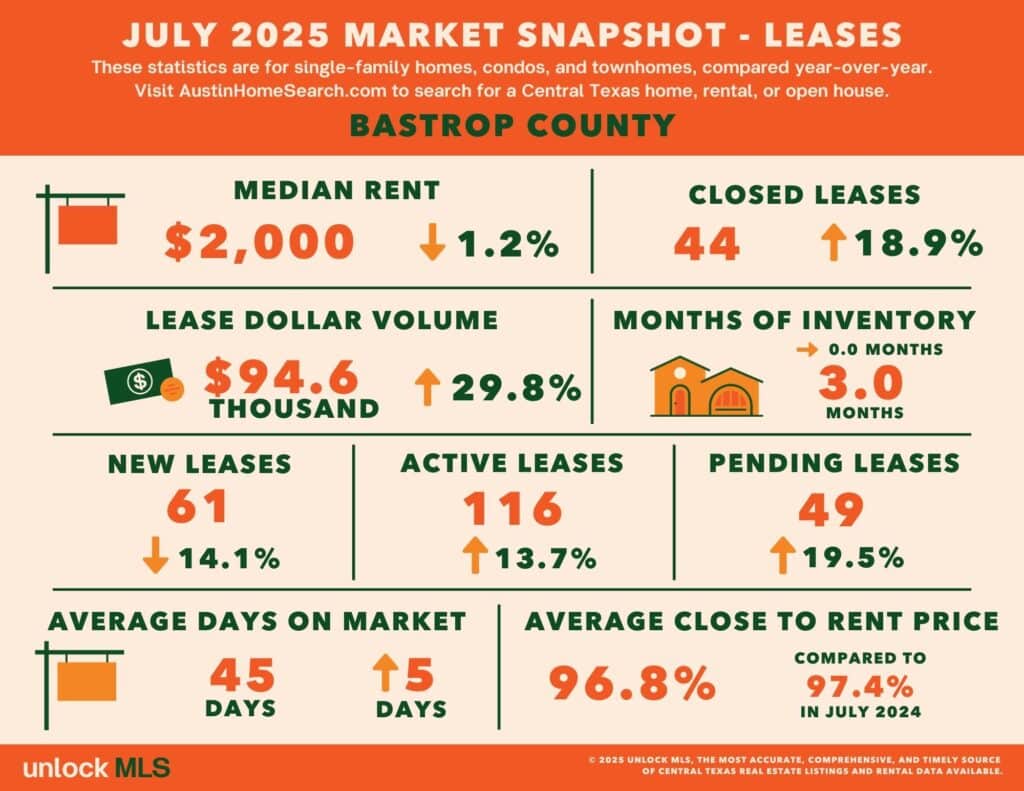
Bastrop County
In Bastrop County, the median sales price fell 2.7% to $336,749, and total volume dropped 14% to $42.3M, showing clear signs of summer slowdown. Active listings climbed 19.6%, expanding buyer options and bargaining power.
Rental trends were more upbeat: the median rent edged down 1.2% to $2,000, but lease closings jumped 18.9%, pending leases rose 19.5%, and active listings increased 13.7%, pointing to renewed tenant demand.
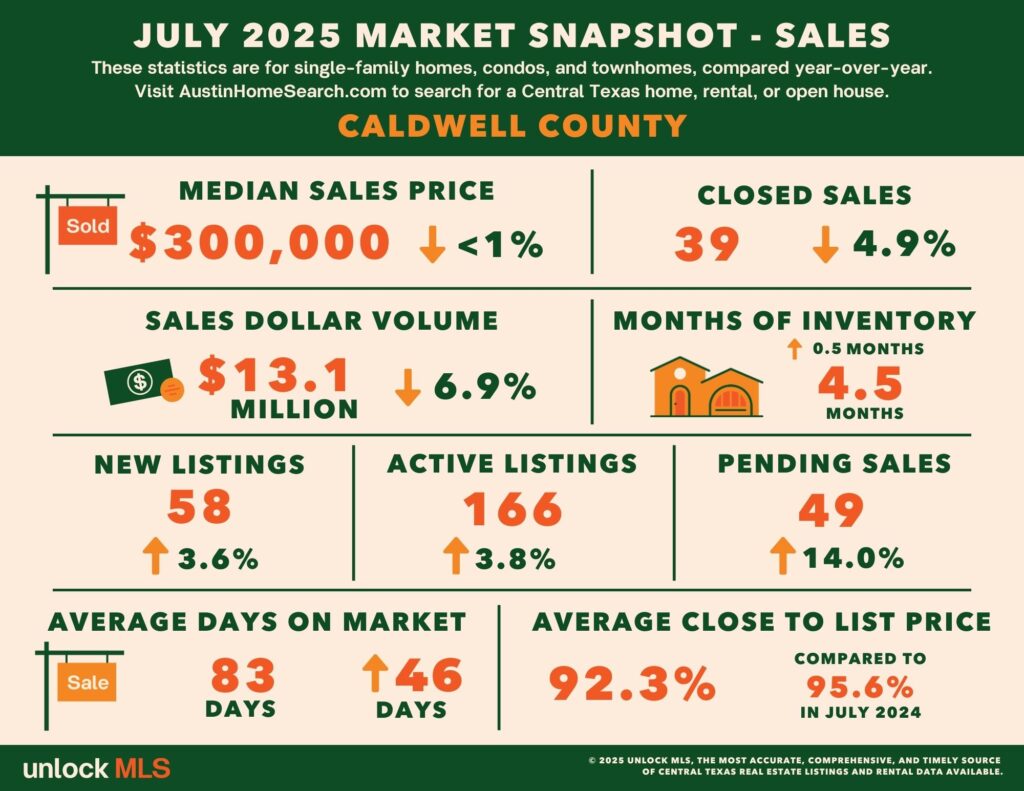
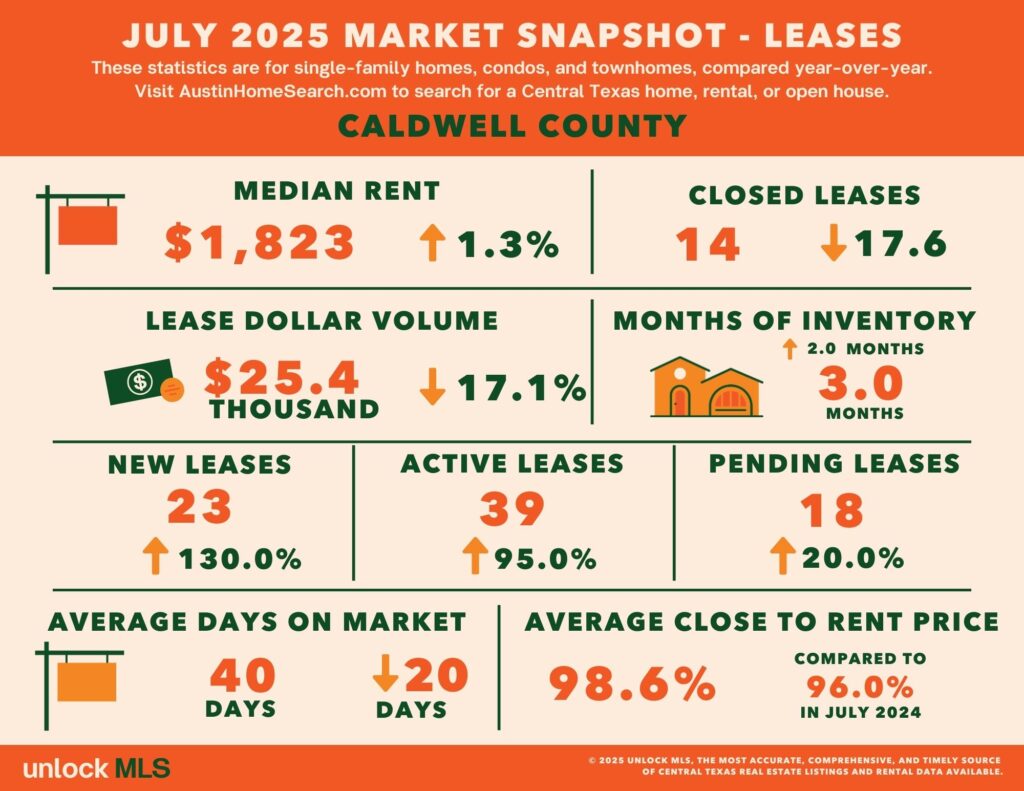
Caldwell County
Caldwell County’s housing market softened slightly, with the median sales price slipping to $300,000 and total volume down. Still, pending sales rose to 49, suggesting stronger buyer intent. Active listings increased 3.8%, helping the market build supply momentum.
In rentals, the median rent rose 1.3% to $1,823, but signed leases dropped to just 14. Meanwhile, a surge in active listings pushed inventory up to three months, signaling landlords are more eager to list while renters remain cautious.
Wondering how to move smart in today’s buyer’s market? Contact us for a tailored strategy that fits your timing, goals, and priorities.