

This article provides an analysis of the June 2025 U.S. Consumer Price Index (CPI) inflation data, as well as leasing and sales activity across major areas in the Austin-Round Rock-San Marcos Metropolitan Statistical Area (MSA).
Data Note: All housing market charts cited in this article are sourced from Unlock MLS. Due to slight differences in reporting periods and geographic coverage, minor discrepancies in numbers may exist. Please focus on overall trends and market structure when interpreting these signals.
June CPI Update: Inflation Holds Steady
According to the latest report, the U.S. Consumer Price Index (CPI) rose by 0.3% month-over-month and 2.7% year-over-year in June 2025, in line with market expectations. Core CPI, which excludes food and energy, increased by 0.2% month-over-month and 2.9% year-over-year, signaling a continued but moderate inflation environment.


Austin Housing Market in June: Stability Above, Activity Below
According to Unlock MLS data, the Austin housing market experienced a brief surge at the end of June, with Week 26 recording 1,205 newly signed contracts – the highest weekly count in 2025 so far and significantly higher than the same period last year. This uptick was partly driven by buyers seeking to finalize purchases ahead of summer travel, prompting a release of previously pent-up demand.

The median days on market in June dropped to 37 days, down sharply from 54 days in June 2024 and lower than 2023 levels. However, this quicker turnover was concentrated in specific neighborhoods and price ranges – broad-based market momentum has yet to take shape.

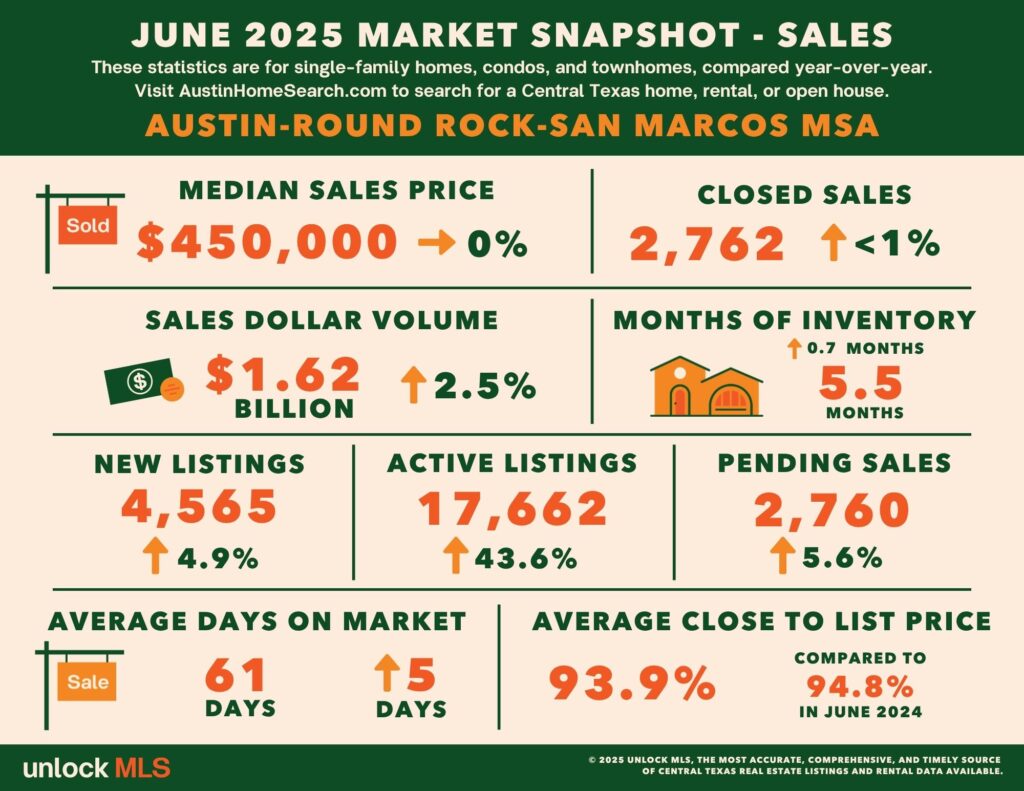
The Austin-Round Rock MSA saw approximately 4,047 new listings in June – a slight dip from May but still considered elevated. Single-family homes made up over 90% of the listings. On the demand side, 3,861 new pending contracts were recorded, nearly matching new supply and reflecting a tight supply-demand balance.


✨ But here’s the surprising twist: It was Active Listings that surges. The sharp rise in housing inventory is quietly reshaping the market, bringing clear signs of a buyer’s market.
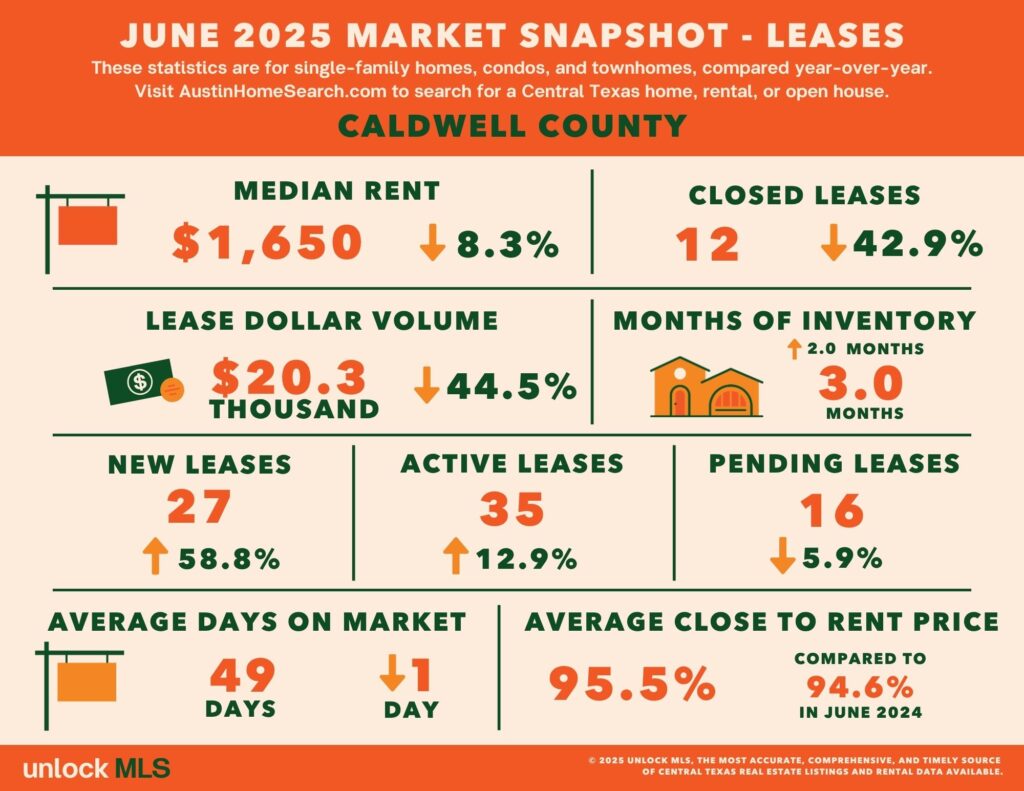
County-Level Market Highlights
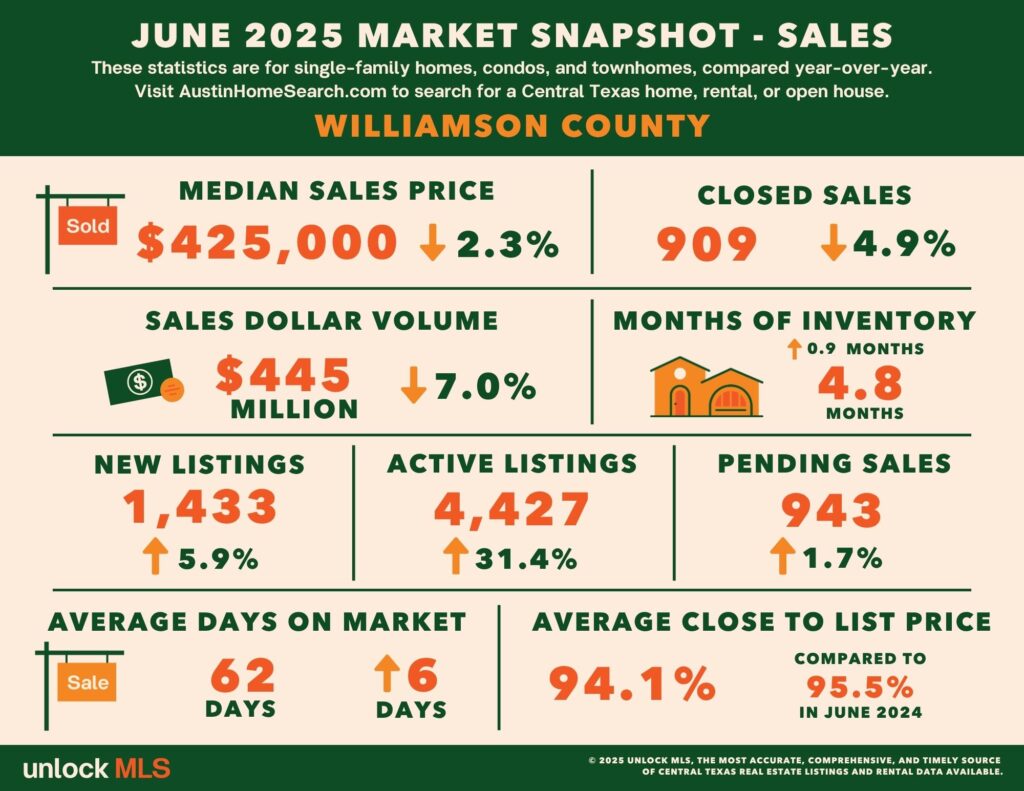
Although the metro median home price held steady at $450,000 and total sales volume reached $1.62 billion (up 2.5% YoY), these figures mask a deeper trend: seller-side inventory is piling up fast. Pending sales rose 5.6%, but that momentum is overshadowed by the pace of new listings. Active Listings across the Austin–San Marcos MSA jumped 43.6% year-over-year, with double-digit gains in City of Austin, Williamson, Bastrop, and Travis Counties. The most dramatic was the City of Austin, where Active listings surged by 86.9% – a clear sign of growing pressure on sellers.
As a result, the market has firmly entered a high-inventory, buyer-driven phase. Buyers now have more options, more leverage, and better chances of negotiating a deal – particularly with motivated sellers looking to exit quickly.
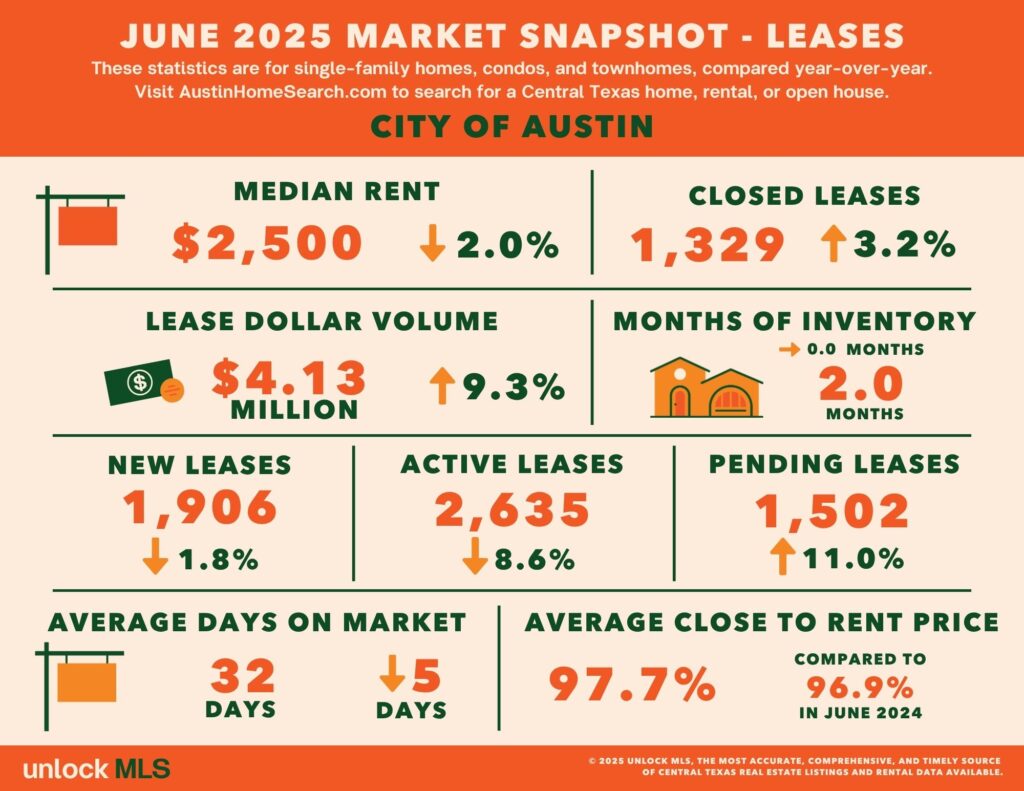
City of Austin
While the median sales price remained flat at $590,000, the number of homes sold rose 10.8% to 961 units. Pending sales increased by 5.8%. The headline, however, was the 86.9% jump in active listings – reaching 5,542 units.

On the rental side, the median lease price dipped slightly to $2,500 (–2% YoY), but total lease volume climbed 3.2%. The average days on market shortened to 32, and pending leases rose 11%, pointing to stronger leasing activity downtown.
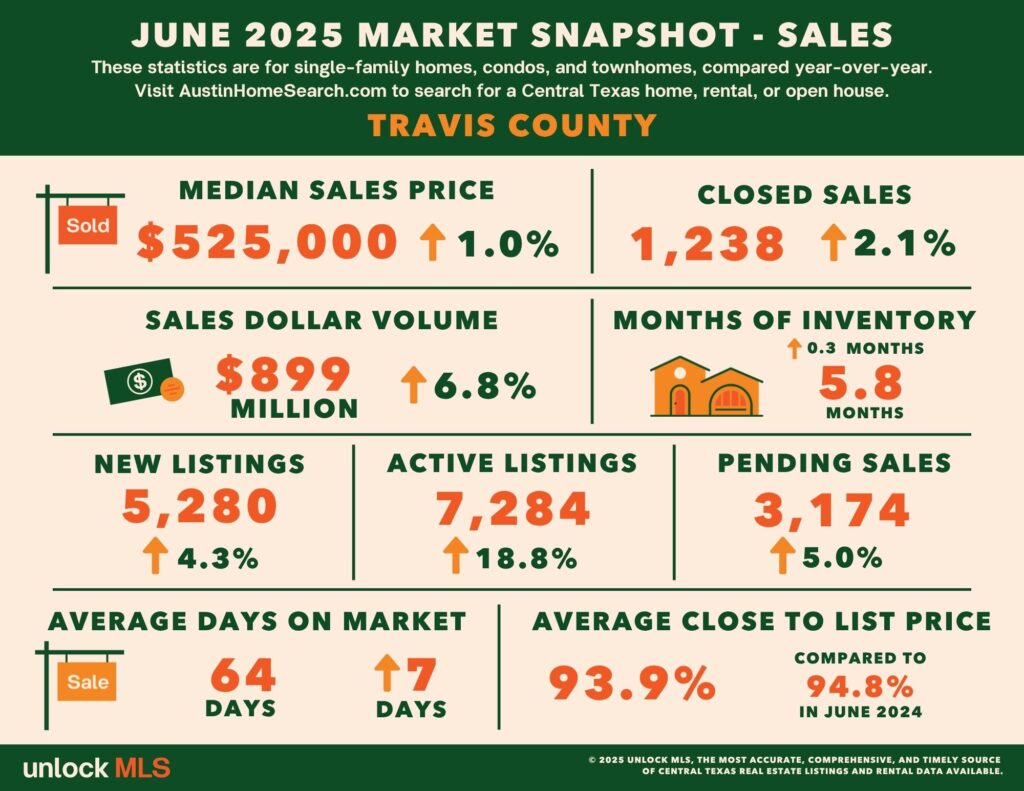
Travis County
Sales volume increased 6.8% YoY to $899 million, with the median home price ticking up 1% to $525,000. Transaction volume grew modestly (2.1%), and pending sales rose by 5%. Active listings rose to 7,284, up 18.8% YoY.