


This article gives a balanced, data-driven look at the latest macroeconomic shifts and analyzes August 2026 residential sales activity in the City of Austin.
(Note: Austin housing market data in this article is sourced from Agent Intel and covers residential properties within the City of Austin. Monthly figures reflect August 2026, while pricing, days on market, and negotiation metrics reflect the rolling 12-month period from September 2025 through August 2026. Some comparisons are estimated from chart data. Please focus on overall trends and market structure when interpreting these signals.)
Macroeconomic Snapshot
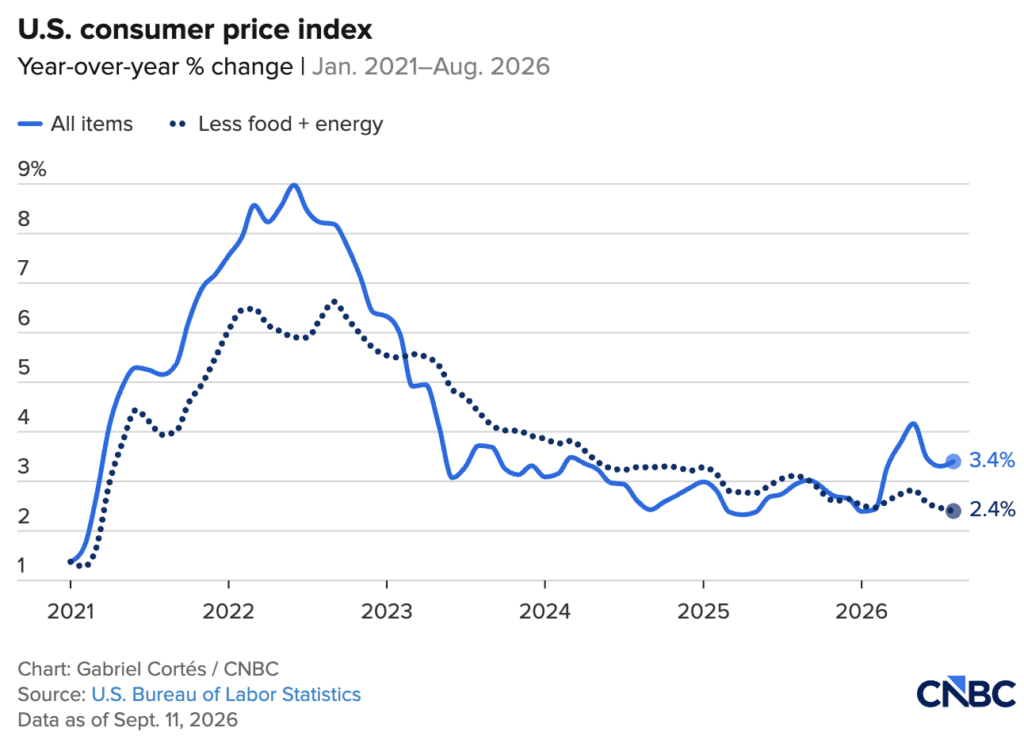
According to the Bureau of Labor Statistics, the Consumer Price Index (CPI) rose 0.4% month-over-month in August, up from 0.1% in July. Year-over-year inflation held steady at 3.4%, in line with expectations. Gasoline was the main driver, with the gasoline index jumping 3.9% and accounting for more than one-third of the monthly increase.
Core CPI, which excludes food and energy, painted a calmer picture. Core inflation eased to 2.4% year-over-year, down from 2.5% in July and the lowest level since March 2021, although the monthly core reading of 0.3% came in slightly above forecasts.
In September, the Federal Reserve moved from signals to action. The Fed raised its benchmark rate by 25 basis points to a target range of 3.75%–4.00%, its first increase since July 2023. Chair Kevin Warsh emphasized that price stability remains the Fed’s top priority, and 16 of 18 officials projected at least one more hike before year-end.
Mortgage rates have moved higher as well. According to Freddie Mac, the average 30-year fixed rate reached 7.03% as of September 24, up from 6.95% the prior week and 6.30% a year ago. It is the first time rates have topped 7% since January 2025, after briefly dipping below 6% at the end of February.
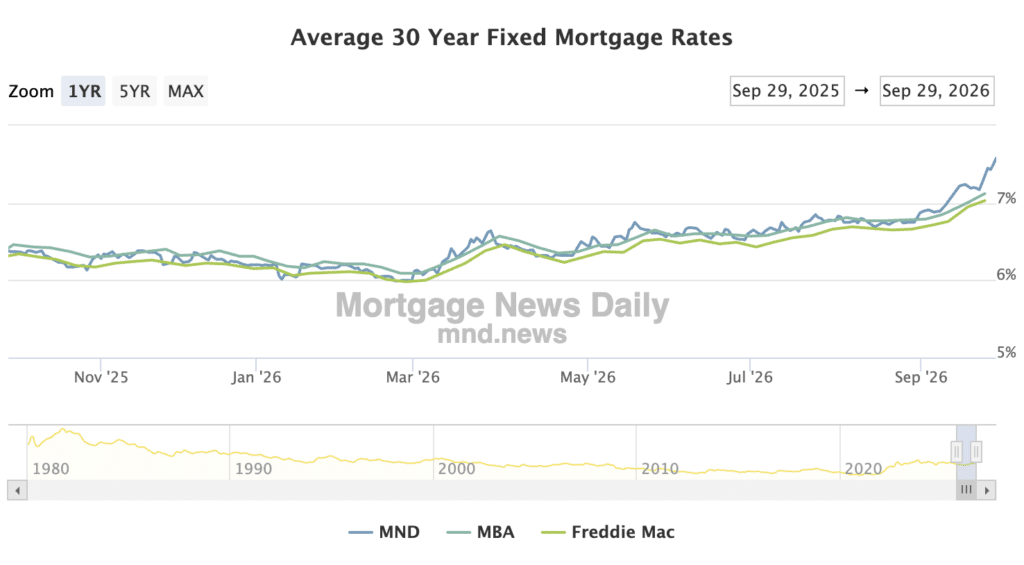
The takeaway: Mortgage rates in August hovered around 6.6%–6.7%, and the climb above 7% took place in mid-to-late September. This means the August housing data below does not yet fully reflect the latest rate increase, making the September and October numbers especially worth watching.
City of Austin Housing Landscape
Market Overview: Firmly in Balanced Territory
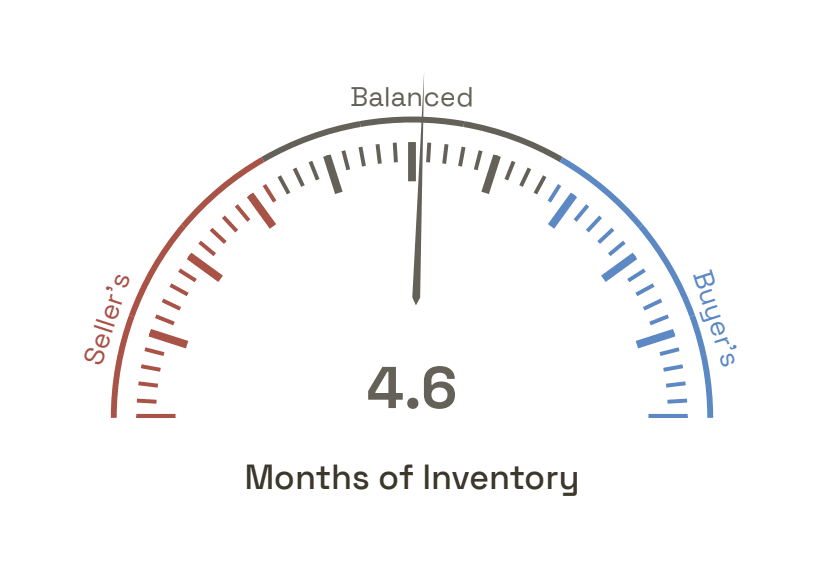
The City of Austin posted 4.6 months of inventory in August, placing the market squarely in balanced territory. Over the past 12 months, months of inventory averaged 4.95, down from 5.38 the year before. This indicates that the market has tightened slightly on an annual basis, with buyers and sellers on more even footing.
August 2026 at a glance:
- New listings: 1,339
- Price reductions: 1,203
- New pending sales: 809
- Closed sales: 891
- Withdrawn listings: 470
- Expired listings: 201
Supply: Inventory Eases Year-Over-Year
By the end of August, the City of Austin had roughly 4,700 active listings, down from about 4,950 in July and approximately 5,200 a year ago. That is a year-over-year decline of about 10%. Even so, inventory remains well above the 10-year August average of roughly 3,500, so buyers still have considerably more choice than before the pandemic.
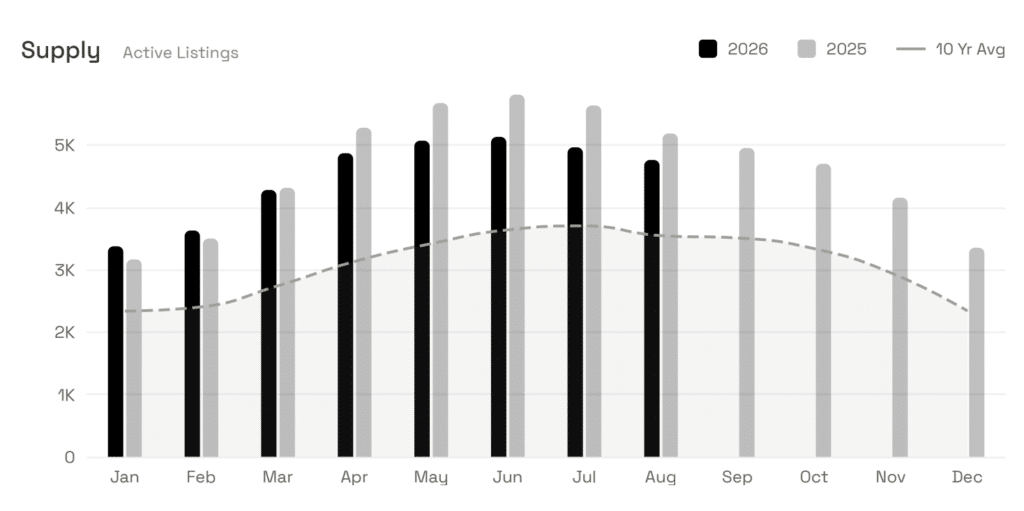
New listings totaled 1,339, essentially flat compared with last August and slightly below the 10-year average. Sellers are entering the market at a steady pace, with no signs of a rush to list.
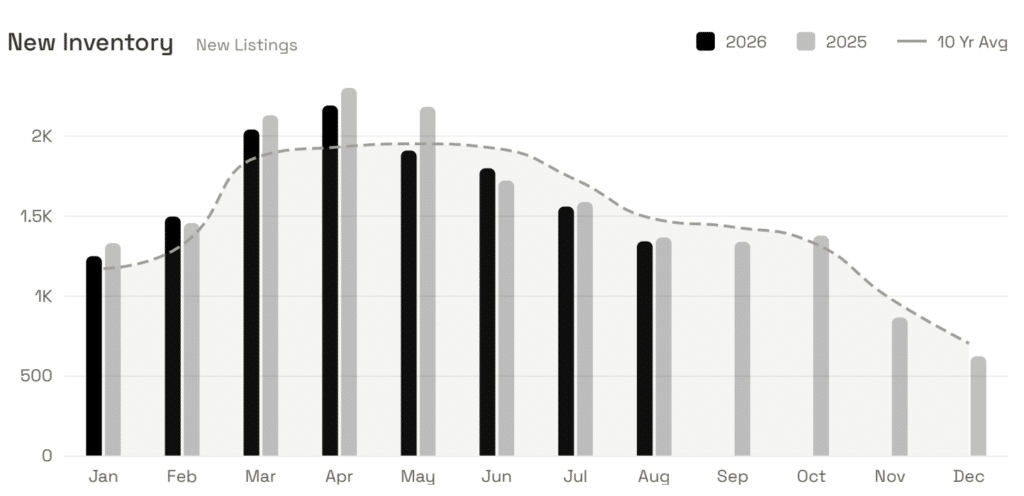
A notable data point: 1,203 listings saw price reductions in August, nearly matching the number of new listings, which means roughly one in four active listings adjusted its price during the month. In addition, 470 listings were withdrawn and 201 expired, a combined 671 homes that left the market without selling, compared with 891 closed sales. These figures underscore the importance of pricing in line with current market conditions.
Demand: Seasonal Slowdown, Stronger Annual Momentum
New pending sales came in at 809 in August, down nearly 20% from about 990 in July and below the roughly 900 recorded last August. With the back-to-school season underway and the summer buying peak behind us, this reflects a typical seasonal slowdown.
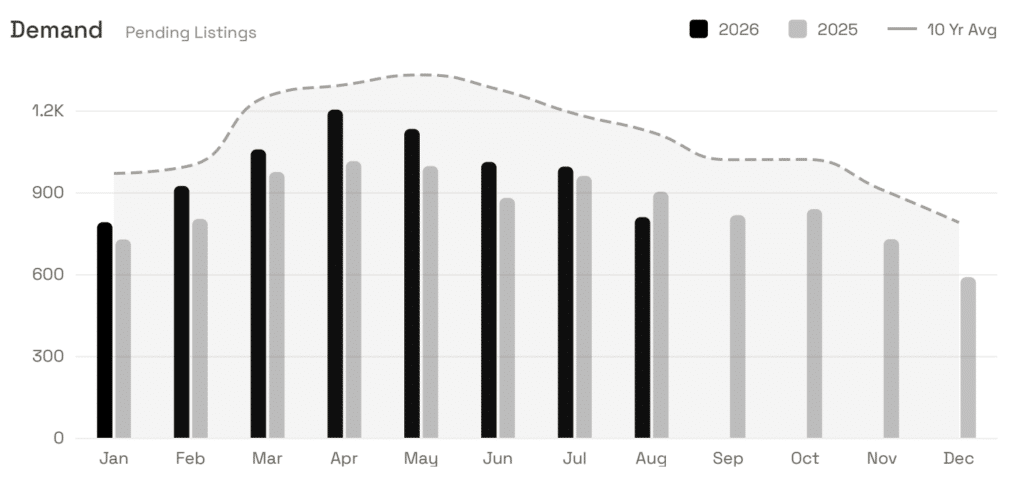
The longer-term picture shows clear improvement. Over the past 12 months, the City of Austin recorded 10,852 closed sales, an increase of 910 homes, or 9.2% year-over-year. Pending sales totaled 10,891, up 7.8%, and total sales volume reached approximately $8.27 billion, up about $655 million.
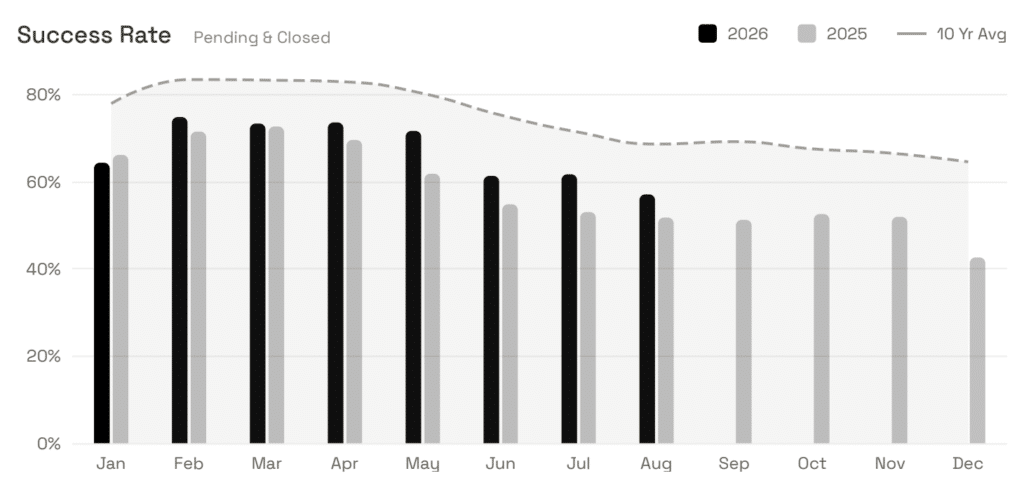
The market’s success rate, which measures the share of listings that go pending or close, also improved. It was about 57% in August, compared with roughly 52% a year ago. On a 12-month basis, the success rate rose to 61.2% from 58.7%. That remains below the 10-year August average of about 69%, which points to a healthier, more measured pace than the frenzied conditions seen during the pandemic.
Pricing: Gradual Softening Supports Sales Activity
Over the past 12 months, the median sales price in the City of Austin was $565,942, down $11,080 or 1.92% from $577,022 the year before. The average sales price held roughly steady at $762,089, and the median price per square foot edged down from $303 to $295.
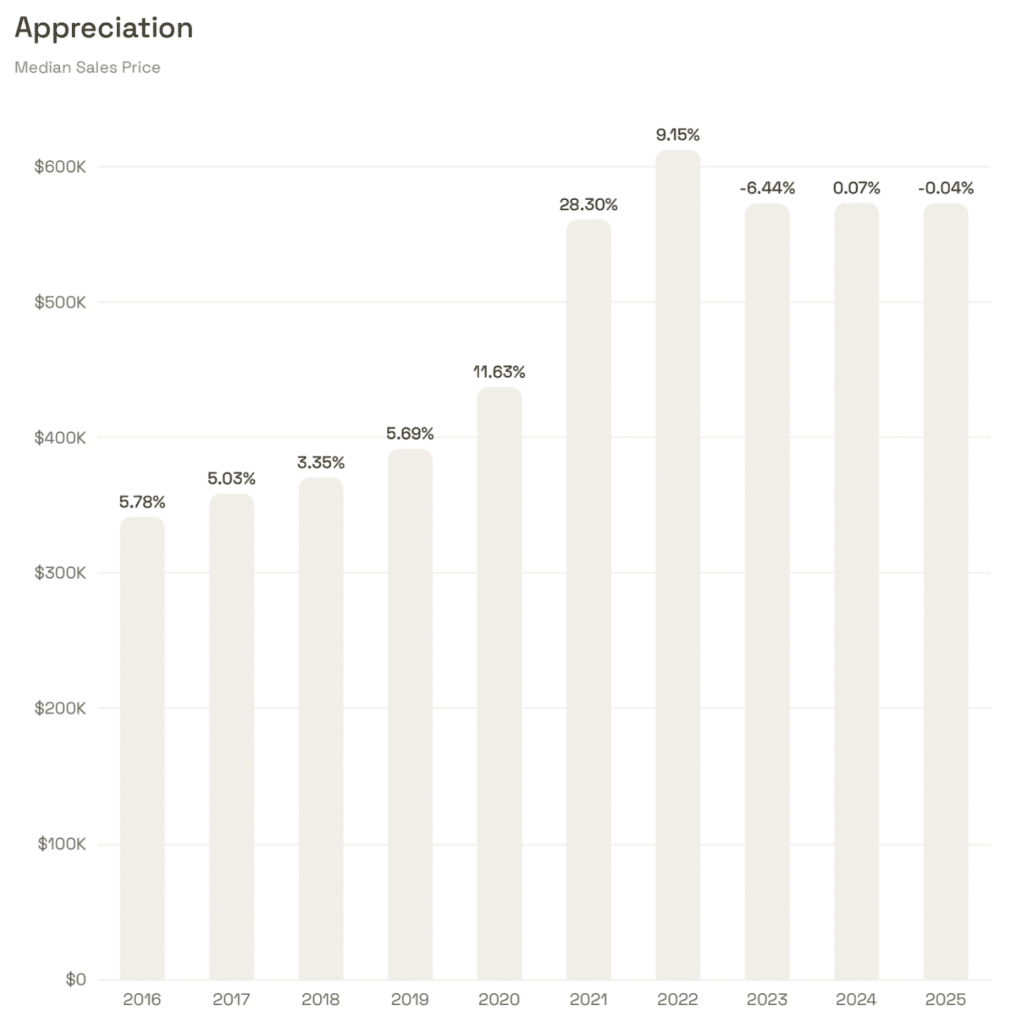
Looking at the annual trend, Austin home prices peaked in 2022, corrected 6.44% in 2023, and remained essentially flat through 2024 and 2025. This year’s modest price adjustment has been accompanied by a meaningful increase in sales volume.
Negotiation: Longer Time on Market, Larger Discounts
Over the past 12 months, listings saw an average reduction of 4.04% from original to final asking price, and homes sold for an average of 3.08% below asking. Combined, buyers paid roughly 7% below original list price on average.

The relationship between time on market and pricing is clear. Homes that sold shortly after listing typically closed within about 2% of asking, and some sold above list. For homes on the market 150 days or longer, the sale-to-list discount widened to around 5%, with cumulative price reductions approaching 10%.
Median days on market came in at 45.7 days, 1.3 days faster than last year, while average days on market rose by about three days to 79.9 days. The gap between the two suggests a market in divergence: well-priced, move-in-ready homes are selling faster, while overpriced listings are lingering longer.

What This Means for Buyers and Sellers
💡 For Buyers: The market continues to move toward balance, giving buyers a relatively wide selection and room to negotiate. With interest rates rising, it is important to make decisions based on your financial situation and to plan your financing early.
💡 For Sellers: Buyer demand remains steady, but buyers are increasingly price-conscious. Pricing your home in line with market conditions and working closely with an experienced agent can help you build the right selling strategy.
Curious about your neighborhood? Market conditions can vary significantly by neighborhood and price range. Reach out to us at info@realinternational.com for a customized market report on the area you are interested in