
Residential home sales decreased across the Austin-Round Rock Metropolitan Statistical Area (MSA) for the first time since May 2020, according to the Austin Board of REALTORS® July 2021 Central Texas Housing Report. Despite the dip, the five-county MSA was just 445 homes shy of breaking the all-time home sales record set in July 2020.
As United States has moved away from the post-COVID boom, the market has begun to stabilize. The typical seasonality for the summer returned as people re-engaged in other activities, including travel. There are fewer instances of dozens of offers over list price even as home prices continue to rise, albeit at a slower rate month to month than the surge experienced in the first half of the year.
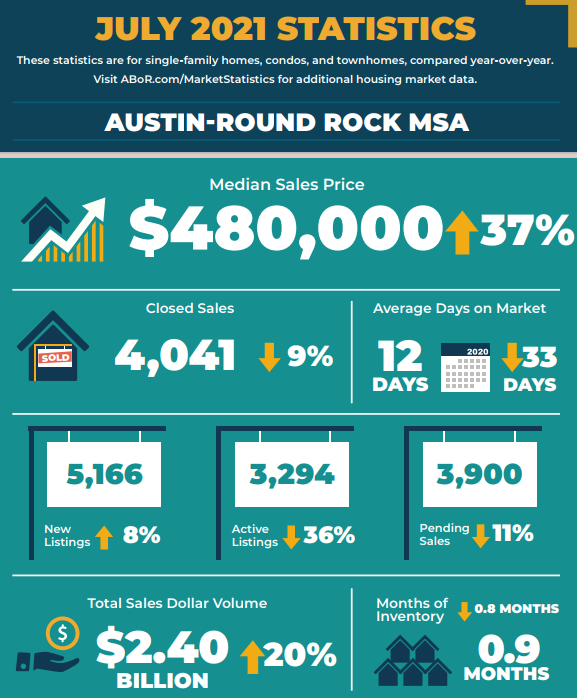
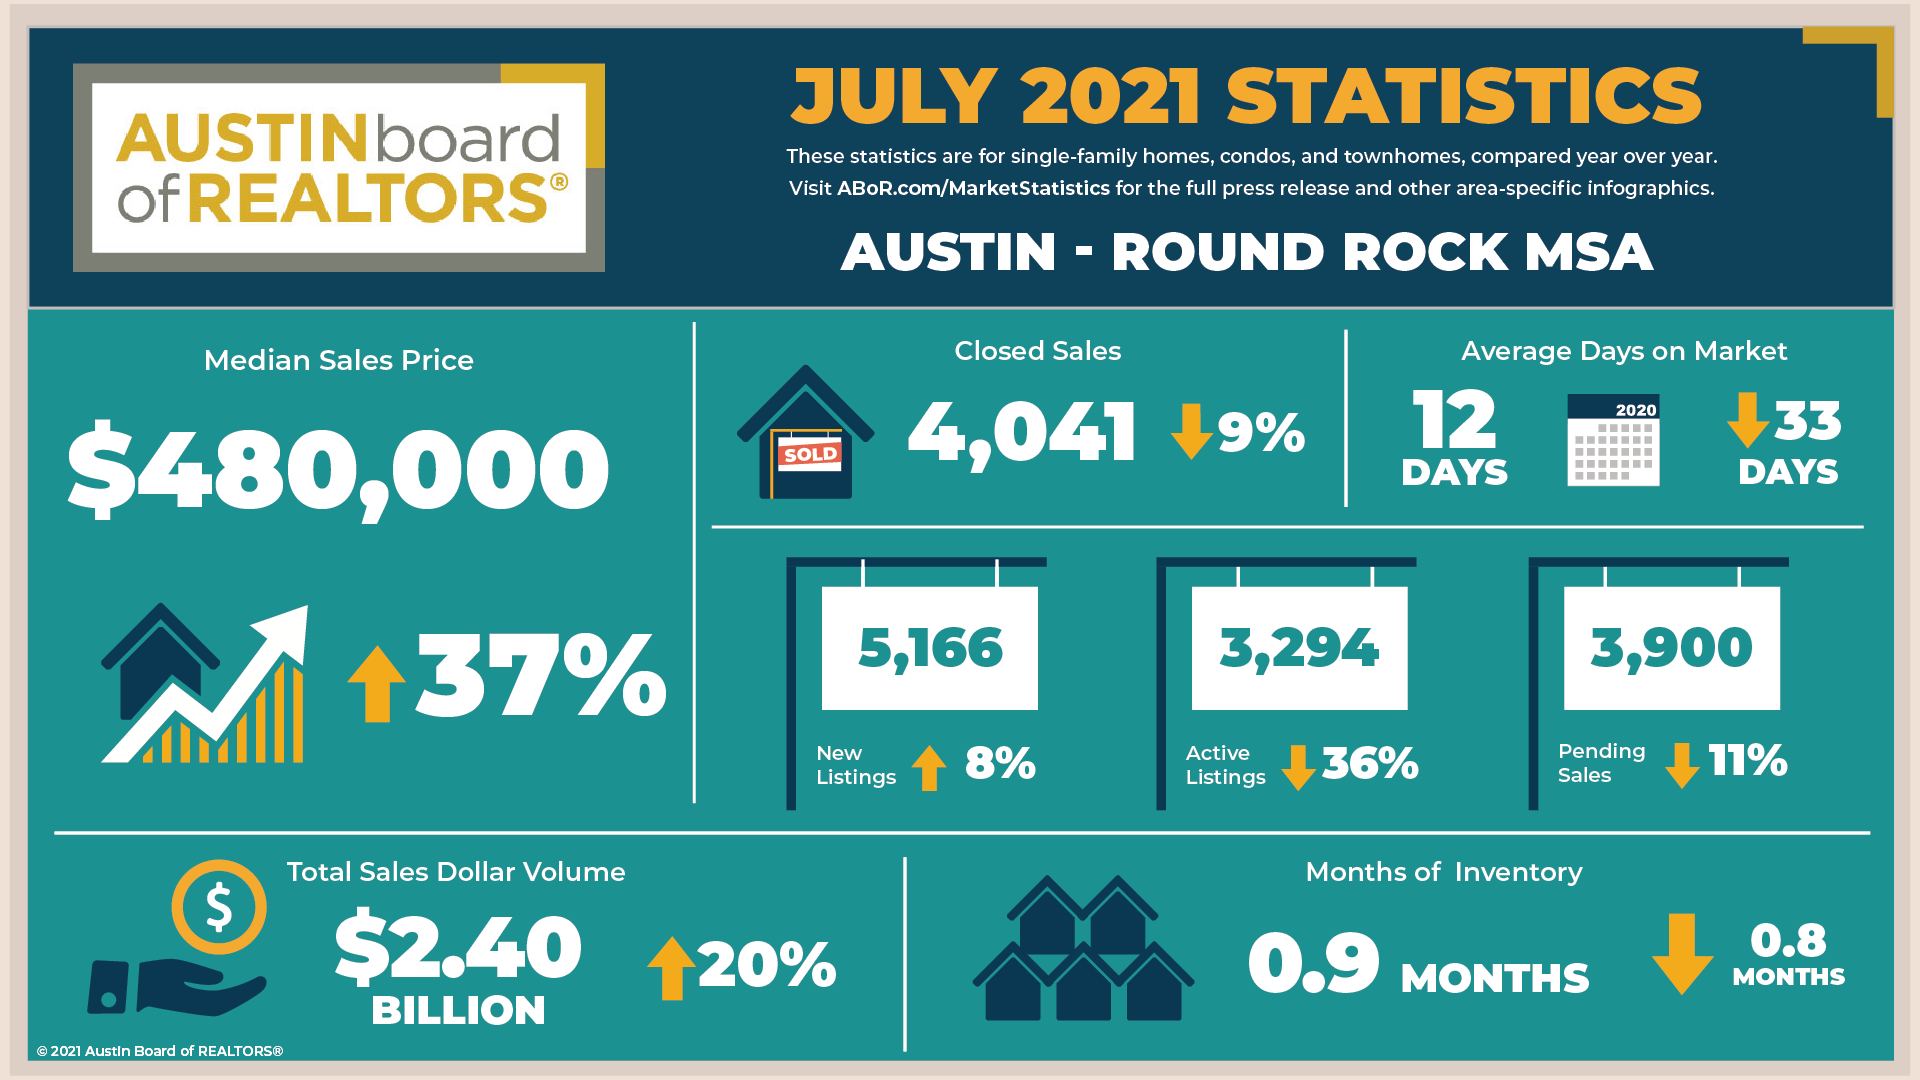
As residential home sales in the Austin Round-Rock MSA declined 9.9% to 4,041, the median sales price jumped 37.1% year over year to $480,000—a record for the month of July. At the same time, sales dollar volume increased 20.7% year over year to $2,409,491,114. Monthly housing inventory dipped 0.8 months to 0.9 months of inventory. While the inventory remains well below a healthy average, inventory has slightly increased since the first half of 2021.
While the frenzy to buy a home in Austin has steadied from this time last year, it’s unlikely that home prices will go down any time soon.
In July, new listings increased 8.2% to 5,166 listings; active listings dropped 36.9% year over year to 3,294 listings; and pending sales declined 11% to 3,900 listings. Homes only spent an average of 12 days on market last month across the MSA.
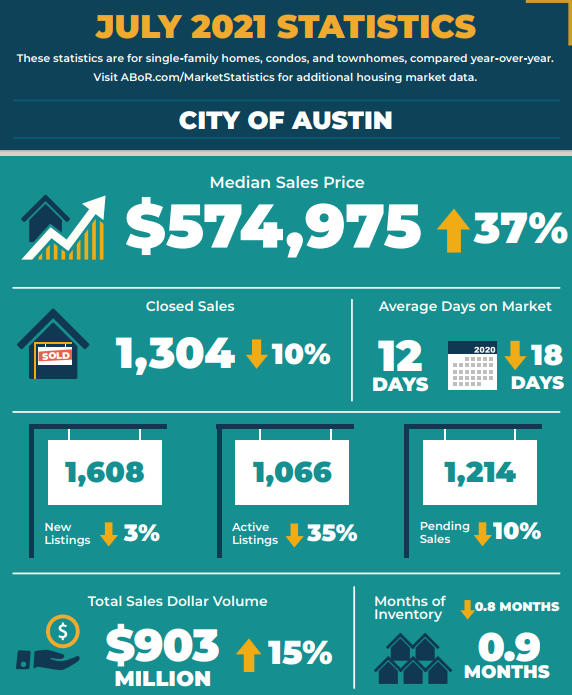
City of Austin
In the city of Austin, the median home price rose 37.6% year over year to $574,975—a record for the month of July. Home sales decreased 10.2% to 1,304 sales, while sales dollar volume increased 15.8% to $903,215,913. During the same period, new listings decreased 3% to 1,608 listings, active listings dropped 35.2% to 1,066 listings, and pending sales decreased 10.2% to 1,214 pending sales. Monthly housing inventory decreased 0.8 months year over year to 0.9 months of inventory.
Travis County
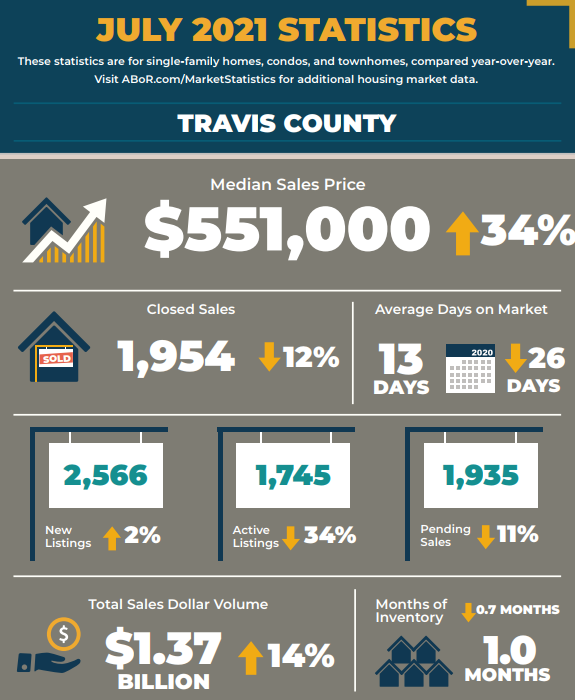
At the county level, home sales also decreased 12.1% to 1,954 sales, and sales dollar volume jumped 14.7% to $1,379,355,724. The median price for a home increased 34.4% year over year to $551,000. During the same period, new listings increased 2.1% to 2,566 listings; active listings declined 34.5% to 1,745 listings; and pending sales decreased 11.2% to 1,935 pending sales. Monthly housing inventory decreased 0.7 months year over year to 1.0 months of inventory.
Williamson County
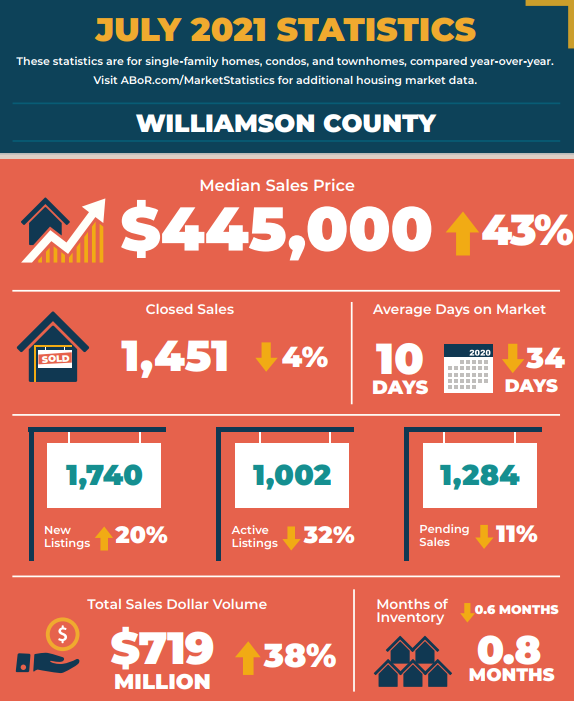
In Williamson County, July home sales decreased 4.9% to 1,451 sales, while sales dollar volume jumped 38.1% to $719,024,219. The median price rose 43.4% to $445,000, and new listings increased 20.2% to 1,740 listings. At the same time, active listings fell 32.9% to 1,002 listings, and pending sales also decreased 11.9% to 1,284 pending sales. Housing inventory declined 0.6 months year over year to 0.8 months of inventory.
Hays County
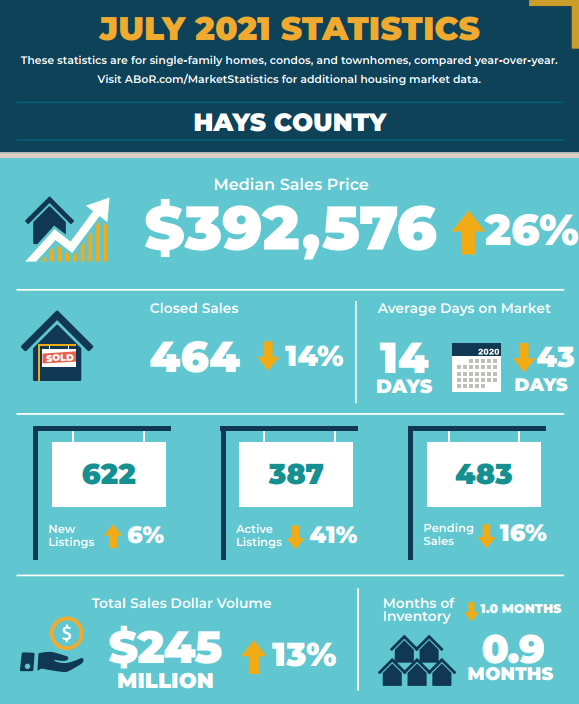
In Hays County, July home sales decreased 14.6% to 464 sales, and sales dollar volume climbed 13% to $245,922,935. The median price for homes increased 26.9% to $392,576. During the same period, new listings rose 6.7% to 622 listings, while active listings decreased 41.9% to 387 listings. At the same time, pending sales decreased 16.9% to 483 pending sales. Housing inventory decreased 1.0 months to 0.9 months of inventory.
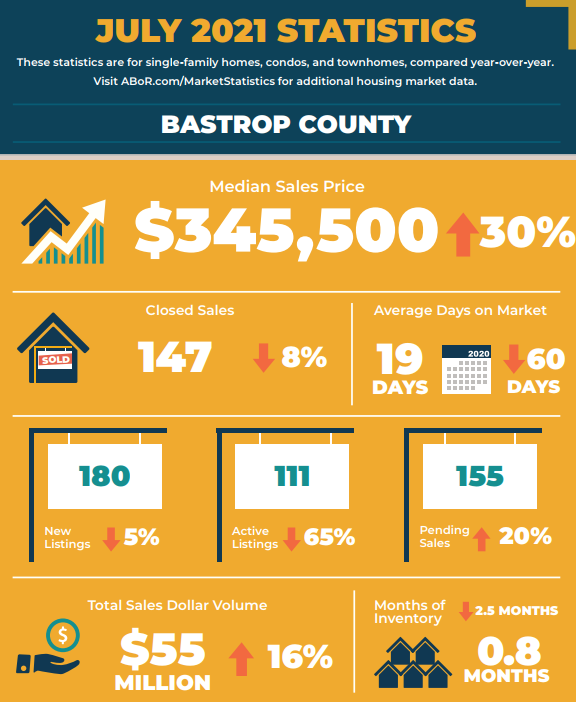
Bastrop County
In July, Bastrop County home sales decreased 8.7% to 147 sales, and sales dollar volume rose 16.3% to $55,506,817. The median price increased 30.1% to $345,500. During the same period, new listings decreased 5.8% to 180 listings, while active listings declined 65.2% to 111 listings. Pending sales rose 20.2% to 155 pending sales. Housing inventory decreased by 2.5 months to 0.8 months of inventory.
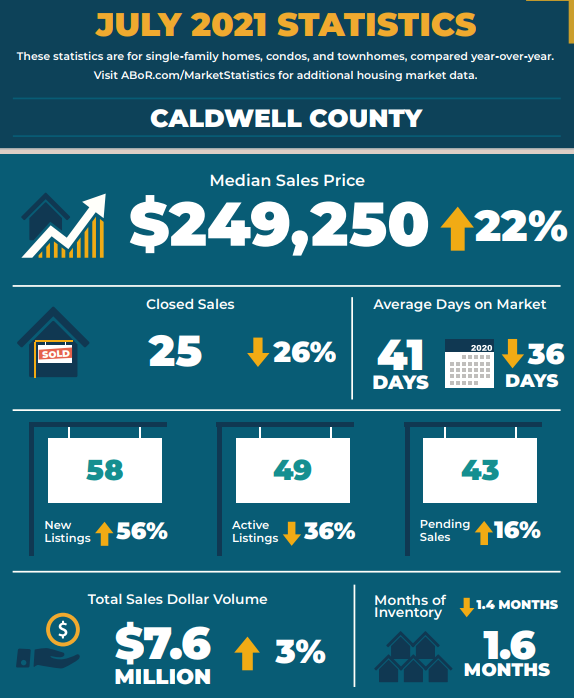
Caldwell County
In Caldwell County, July home sales decreased 26.5% to 25 sales, and sales dollar volume increased 3.4% to $7,677,865. The median home price increased 22.2% year over year to $249,250. At the same time, new listings increased 56.8% to 58 listings, while active listings decreased 36.4% to 49 listings. Pending
sales increased 16.2% to 43 pending sales, and housing inventory decreased 1.4 months to 1.6 months of inventory.