

This article gives balanced, data-driven look at macroeconomic shifts and analyzes May leasing and sales activity across major areas in the Austin-Round Rock-San Marcos Metropolitan Statistical Area (MSA), with added insights into key neighborhoods and high-demand ZIP codes.
(Note: All housing market charts are sourced from Unlock MLS. Due to slight differences in reporting periods and geographic coverage, minor discrepancies in numbers may exist. Please focus on overall trends and market structure when interpreting these signals.)
Macroeconomic Snapshot
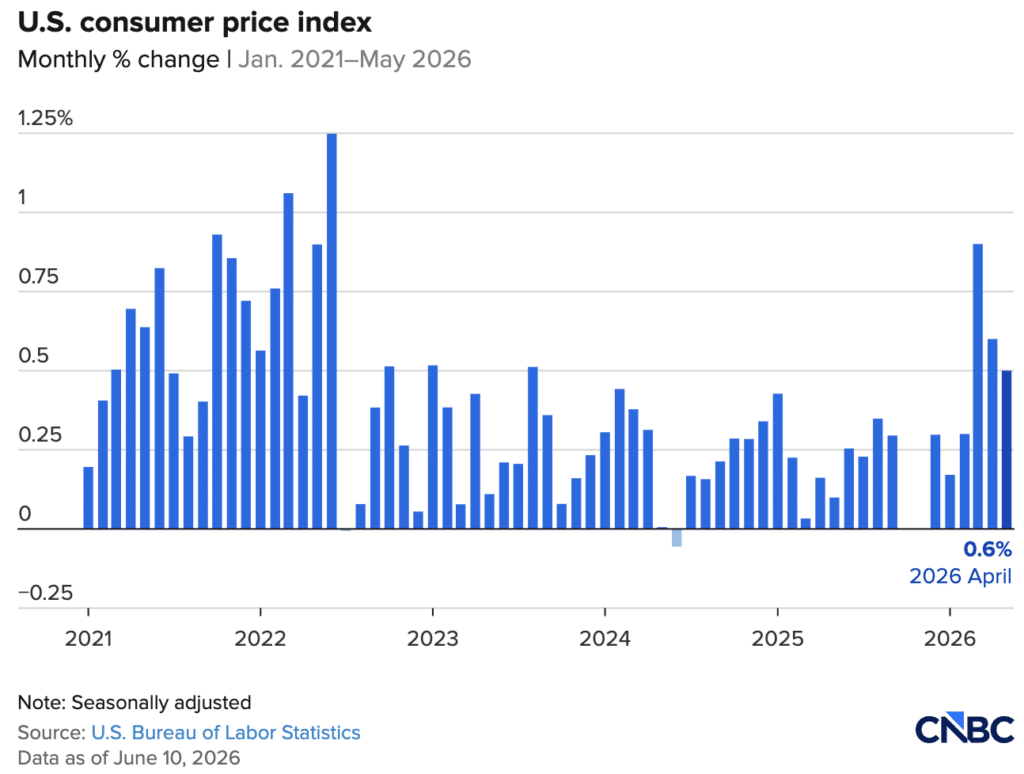
According to the latest data, U.S. headline CPI rose 4.2% year-over-year in May, reaching a three-year high, largely driven by a sharp increase in energy prices.
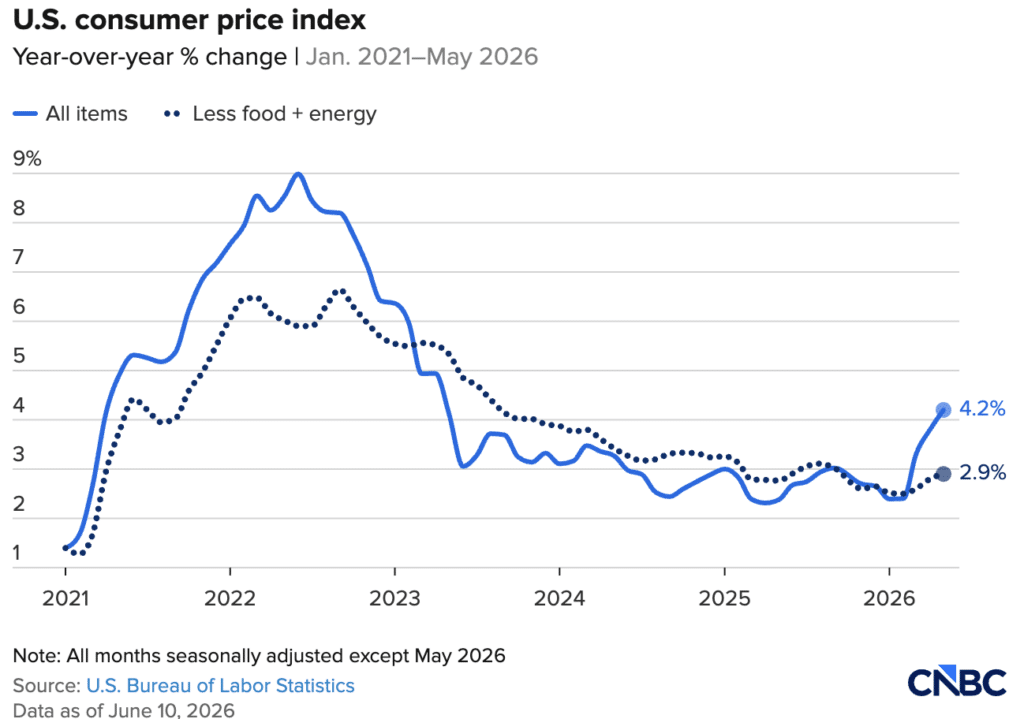
However, core CPI (excluding food and energy) increased by a more moderate 2.9%, with both core goods and housing costs showing signs of deceleration. This suggests that underlying inflationary pressure is actually cooling.
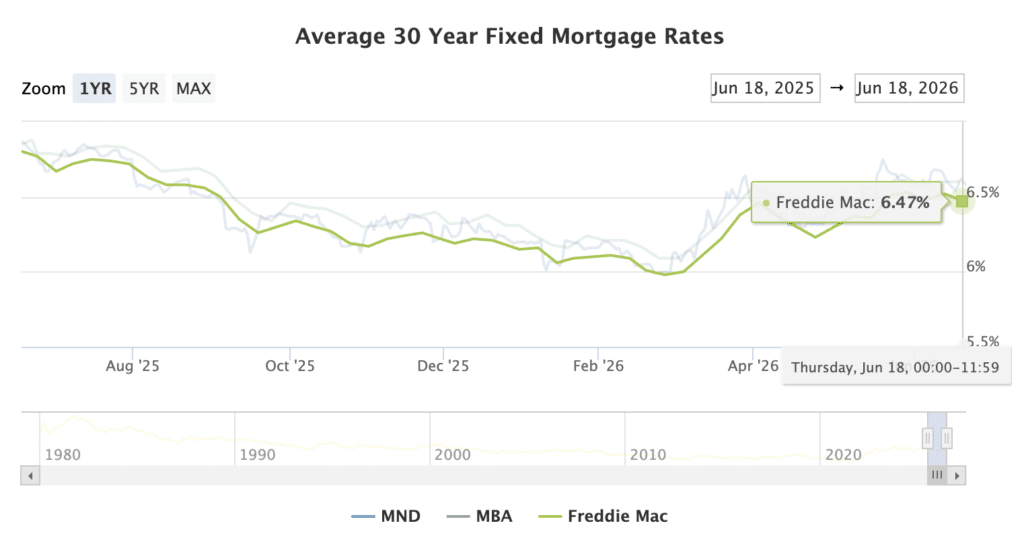
Despite this encouraging signal, the rebound in headline inflation reinforces expectations that the Federal Reserve will likely hold rates steady for most of the year. As a result, mortgage rates are expected to remain within their current range in the near term.
In this environment, waiting for a significant rate drop may not be the most effective strategy. Instead, success will depend on identifying resilient submarkets and targeting high-potential neighborhoods within Austin.
Austin Metro Housing Landscape
In May, Austin’s housing market showed clear signs of acceleration. While national macro conditions, such as rising inflation and weak consumer sentiment, created headwinds, local buyer activity remained strong.
Pending sales continued to climb, while active listings and inventory levels declined noticeably, signaling intensifying competition, particularly in core areas.

Pricing and Sales Activity
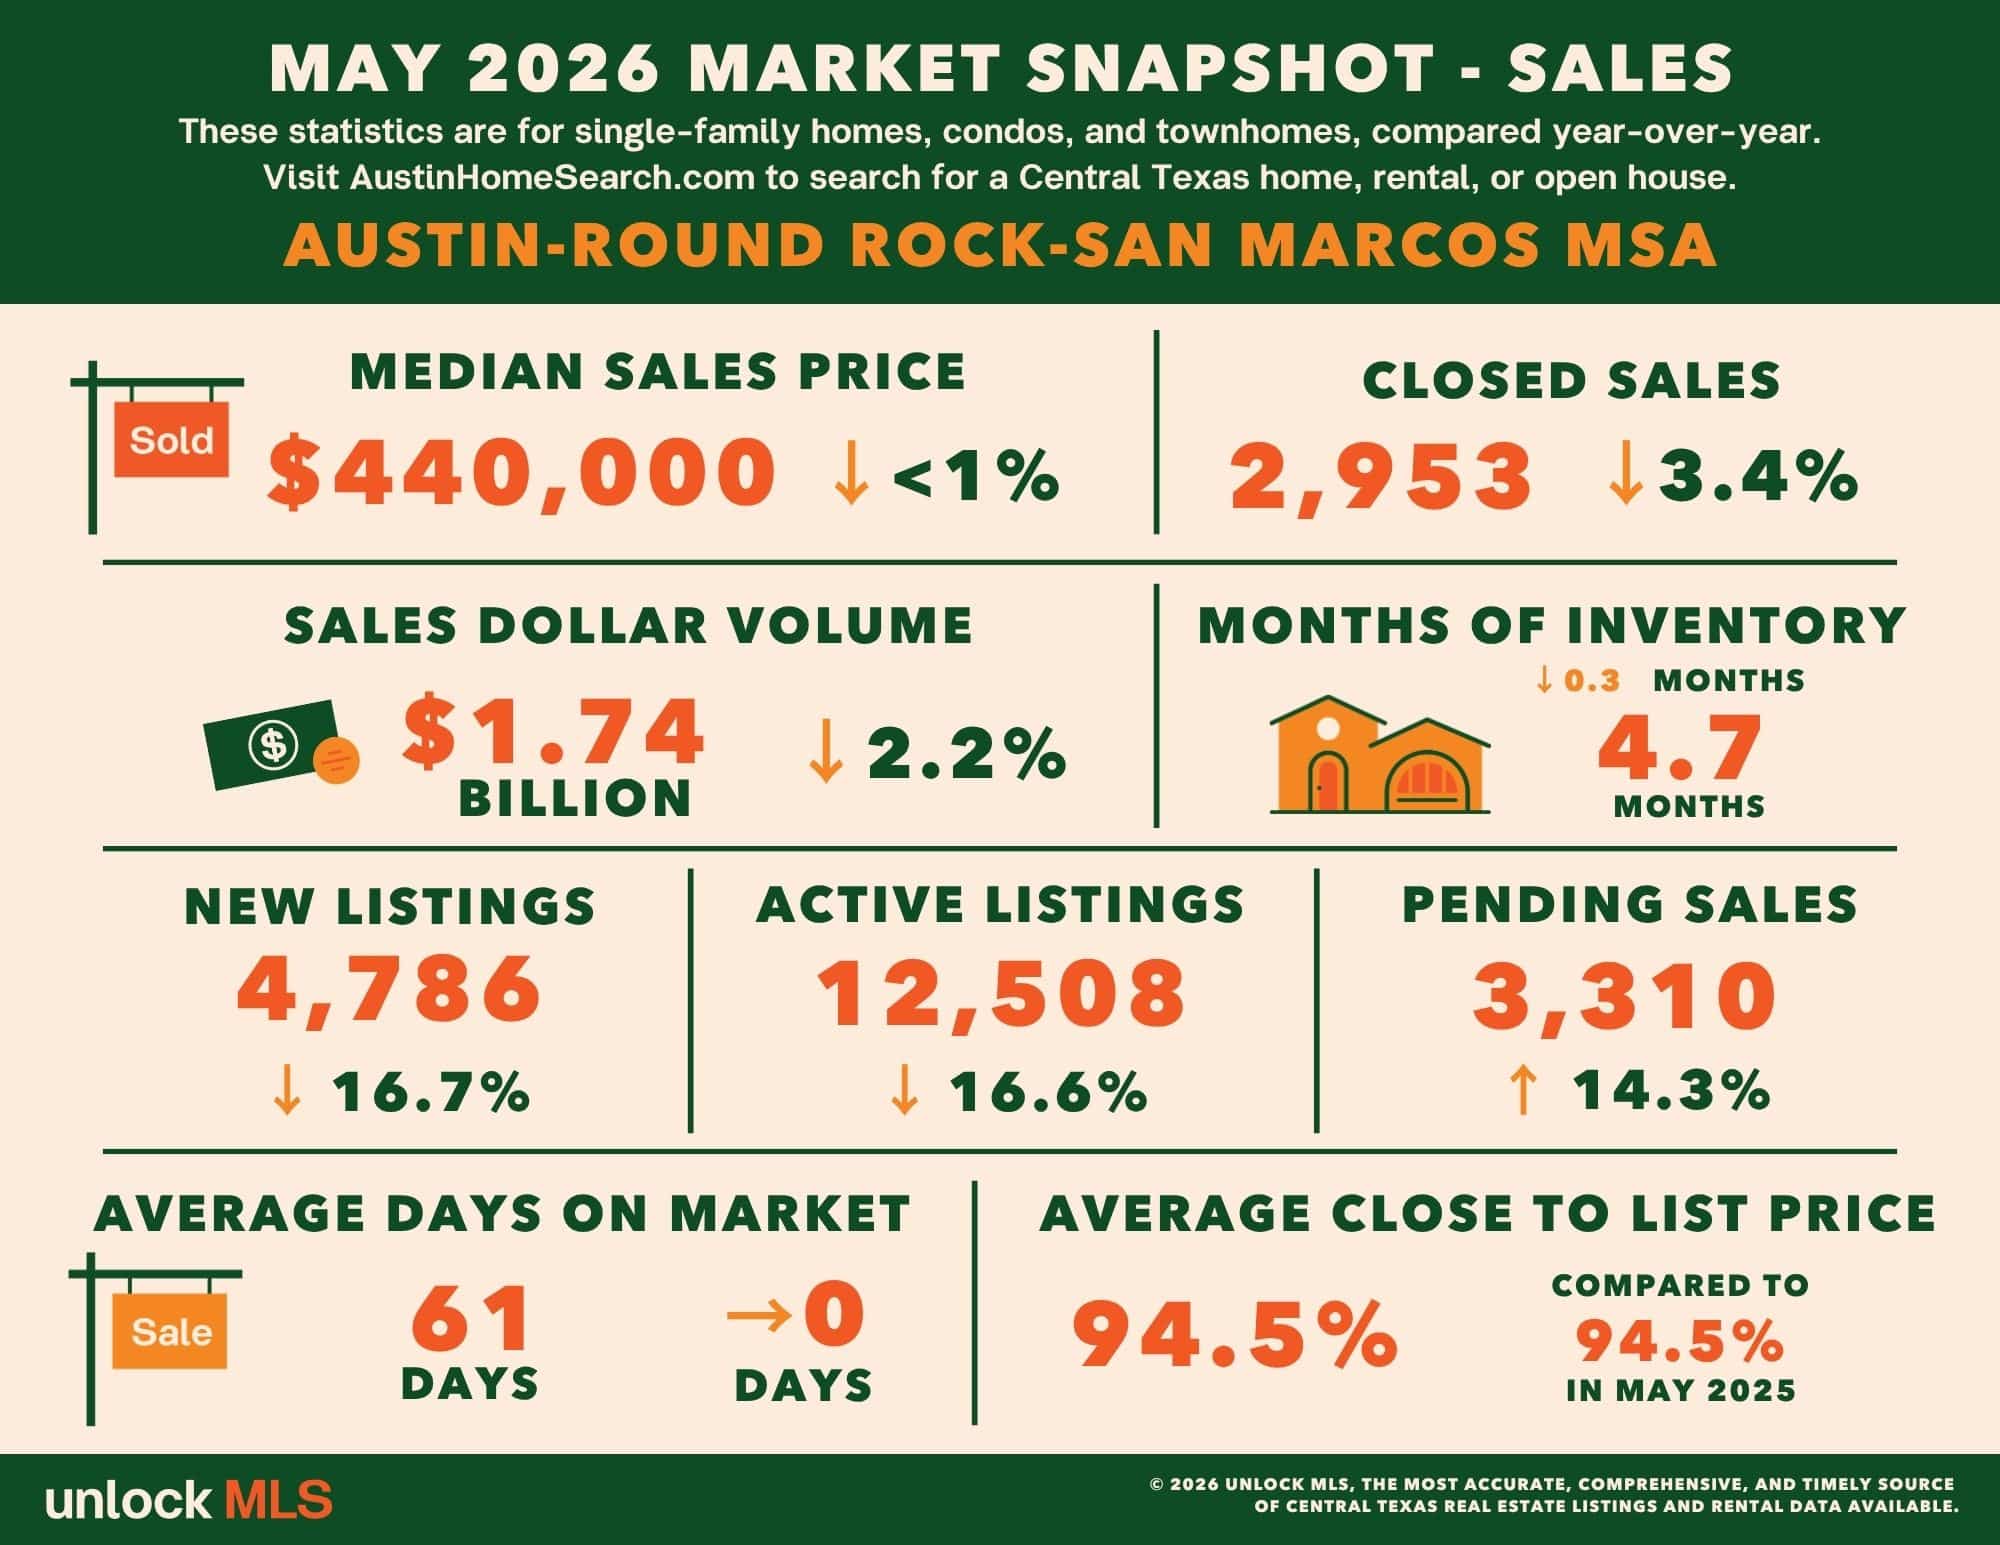
The median home price across the Austin metro held steady at $440,000, down less than 1% year-over-year, indicating that the market has moved past its most volatile phase and is stabilizing.
Closed sales totaled 2,953 transactions, a slight 3.4% decline compared to last year. However, pending sales—a key leading indicator—jumped 14.3% to 3,310. These contracts are expected to convert into closings within 30-60 days, injecting strong momentum into the summer market.
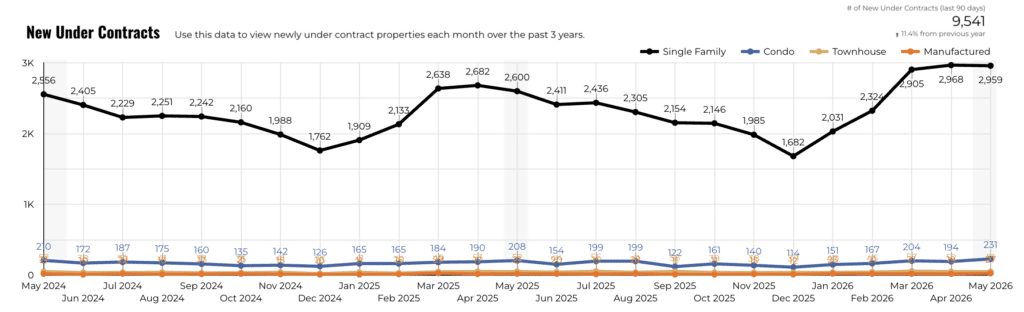
Listings and Inventory: Supply Tightens
Homes are being absorbed quickly, but new listings are not keeping pace.
New listings dropped sharply by 16.7% year-over-year to 4,786, while total active listings declined 16.6%. Inventory levels also tightened, falling by 0.3 months to 4.7 months.
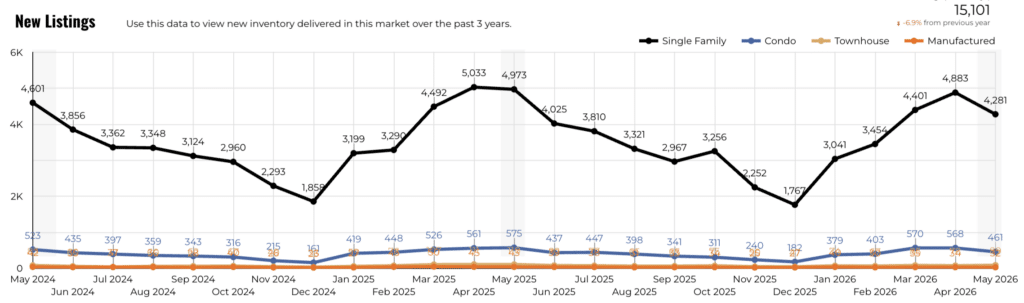
This shift indicates the market is gradually moving away from a strong buyer’s market toward a more balanced environment.
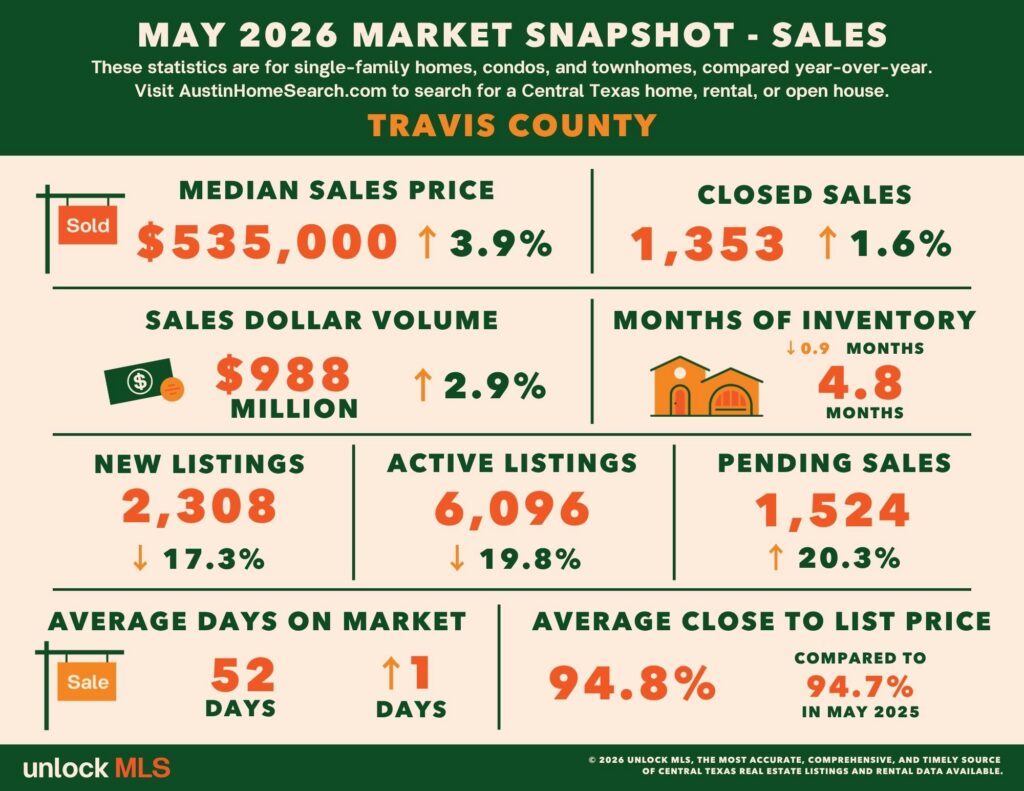
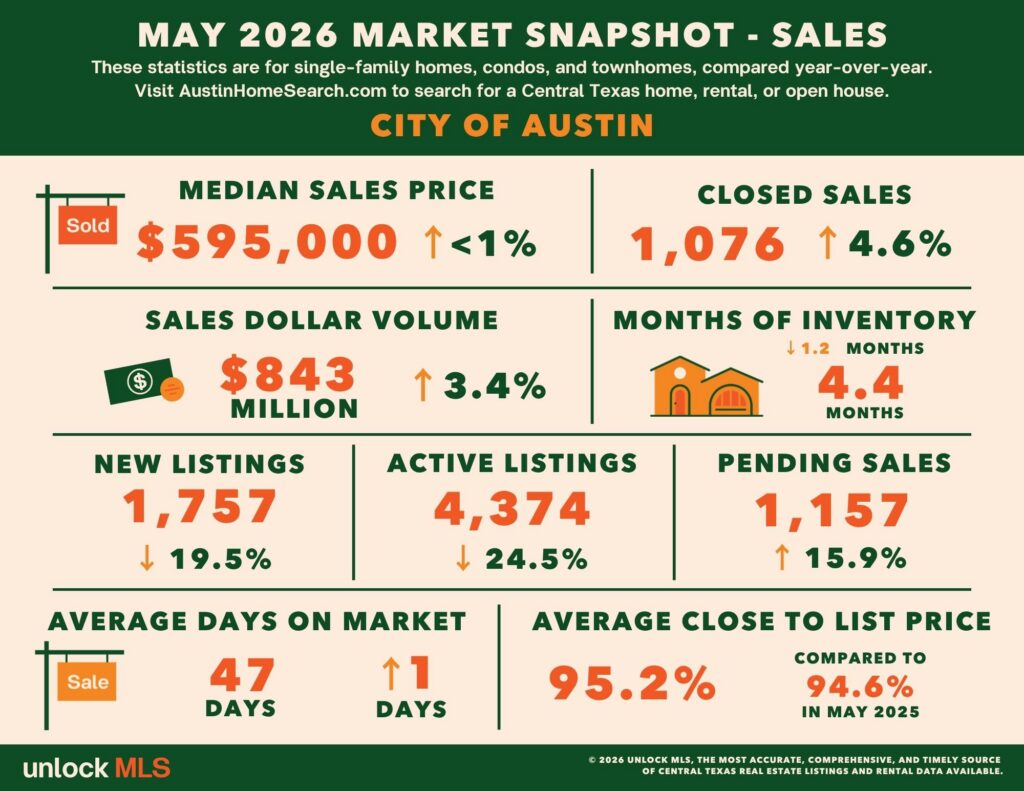
Core areas such as Travis County and the City of Austin highlight this trend clearly:
Travis County saw a strong rebound, with median price up 3.9% to $535,000. Closed sales rose 1.6%, pending sales surged 20.3%, and active listings fell nearly 20%.
City of Austin recorded gains in both price and closed sales. Median price reached $595,000, closed sales increased 4.6%, and pending sales jumped 15.9%. Active listings dropped sharply by 24.5%, and inventory tightened to 4.4 months.
As the broader market stabilizes, the scarcity of quality homes in prime locations is becoming more apparent.
Rental Market: Demand Strengthens Into Peak Season
Austin’s rental market also tightened in May, with inventory pressure easing further.
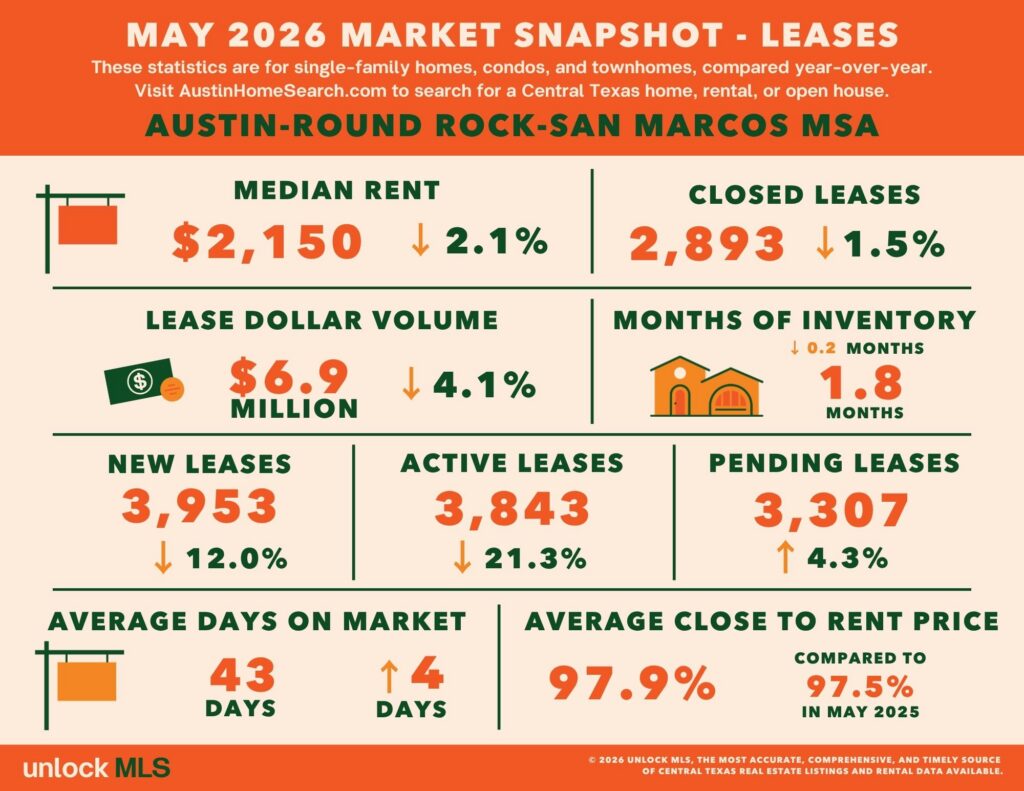
Median rent across the metro came in at $2,150, down slightly by 2.1% year-over-year. However, demand is accelerating into the summer leasing season. New rental listings declined 12.0%, and pending leases increased 4.3%. Inventory dropped to 1.8 months.
This supply-demand imbalance is improving conditions for landlords.
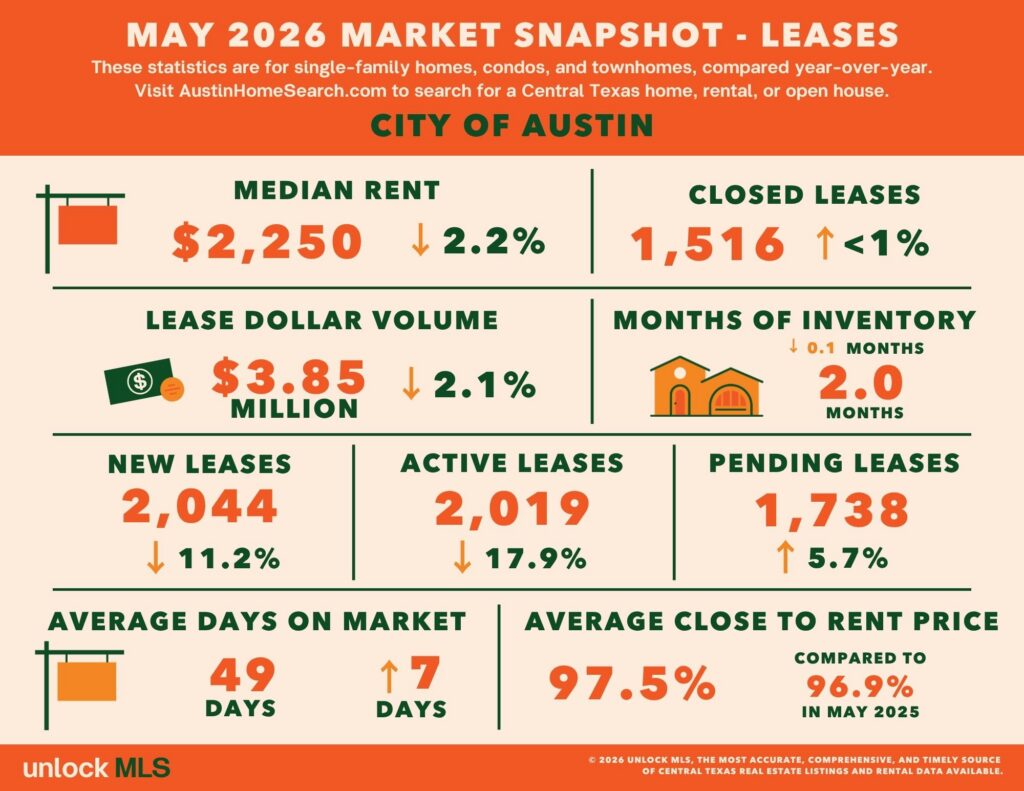
Within the City of Austin: Active rental listings fell 17.9%; Inventory stabilized at 2.0 months; Median rent was $2,250, down 2.2%; Pending leases rose 5.7%.
Moderate pricing adjustments are helping stimulate tenant activity, and as new supply slows, the rental market is moving toward a healthier equilibrium.
Micro Market Trends: Why Location Matters More Than Ever
While overall data points to recovery, Austin has become highly fragmented. Broad market averages no longer tell the full story—micro market performance varies significantly by neighborhood and ZIP code.
Trend 1: Rapid Inventory Contraction and Faster Sales
In several core communities, inventory is shrinking dramatically, and homes are selling at much faster speeds:
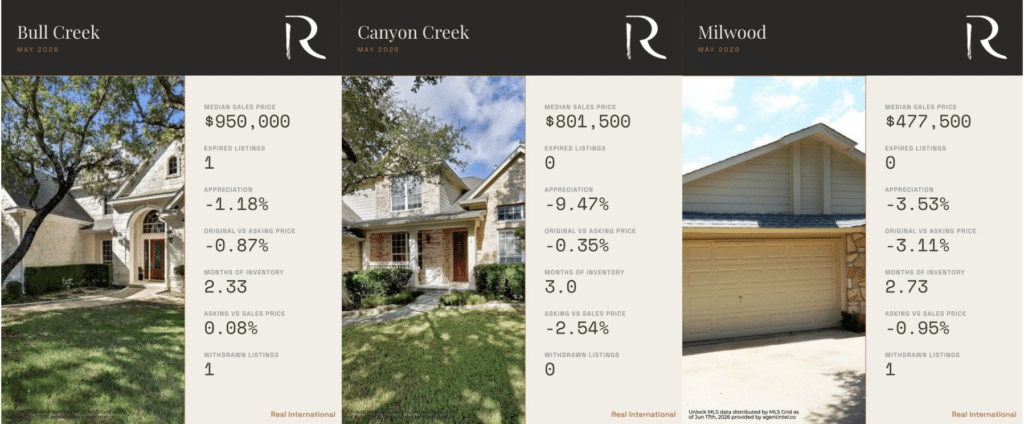
Inventory in Northwest Austin has been cut nearly in half.
Bull Creek inventory dropped from 4.45 to 2.33 months
Canyon Creek fell from 6 to 3 months
Milwood declined from 4.97 to 2.73 months
- In Southwest Austin, homes are selling at a pace measured in days.
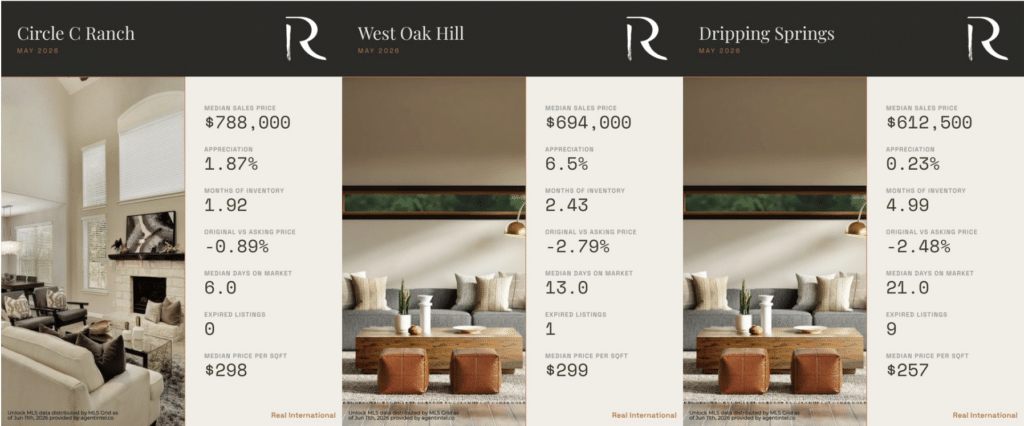
Circle C Ranch and West Oak Hill both saw inventory cut by more than half
Homes in Circle C Ranch sold in a median of just 6 days
Days on market in Dripping Springs dropped from 47 to 21 days
- In key ZIP codes, available homes are being rapidly absorbed by buyers.
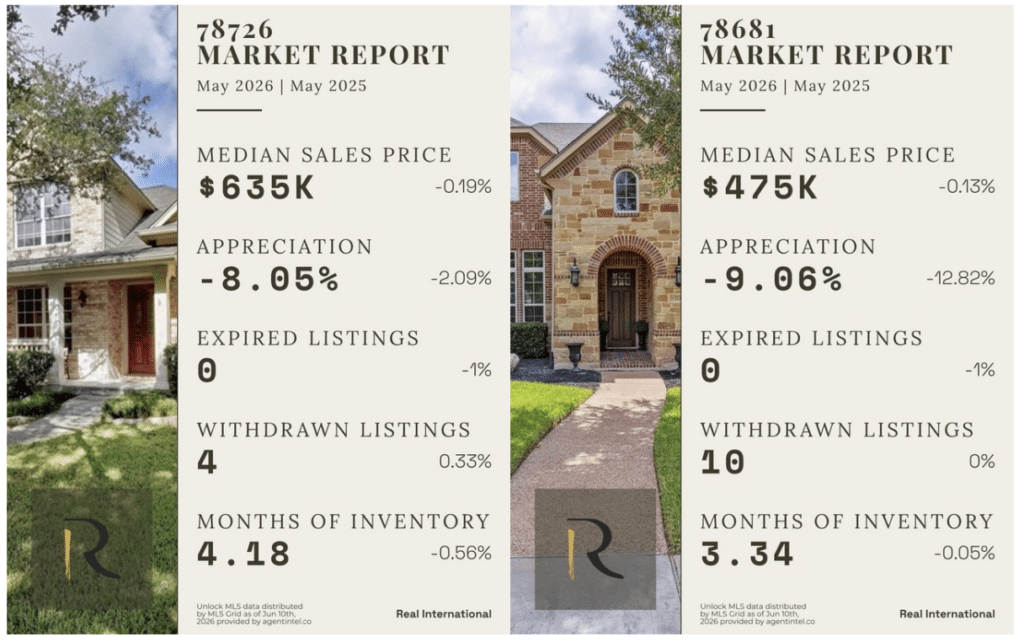
78726 and 78681 saw median prices decline year-over-year, but inventory tightened significantly to 4.18 and 3.34 months, respectively
Across most ZIP codes, available inventory is shrinking and new listings are being absorbed quickly
Trend 2: Price Rebound in Select Neighborhoods
Several established communities that previously experienced corrections are now showing strong recovery momentum:
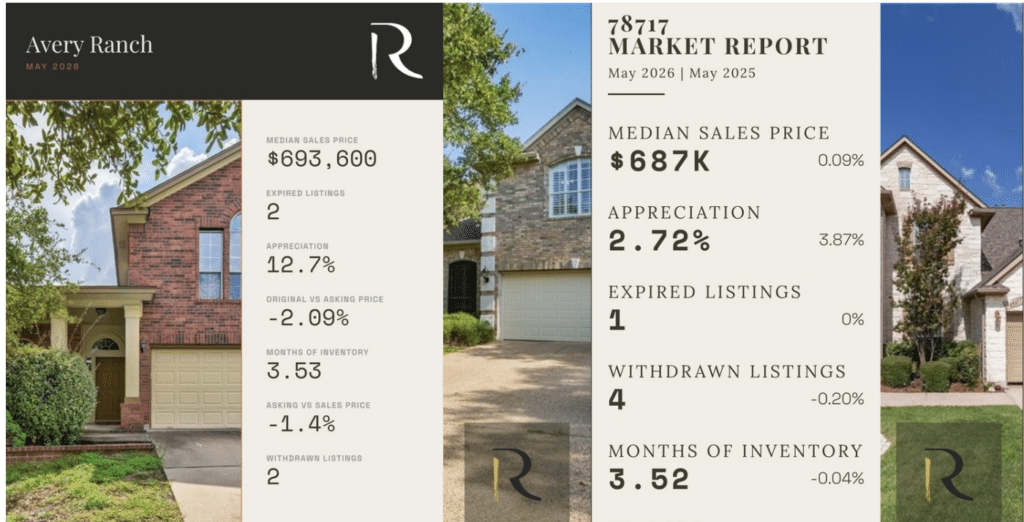
Avery Ranch (78717) rebounded sharply, with prices rising 12.7% after a decline last year
West Oak Hill led Southwest Austin with 6.5% year-over-year growth
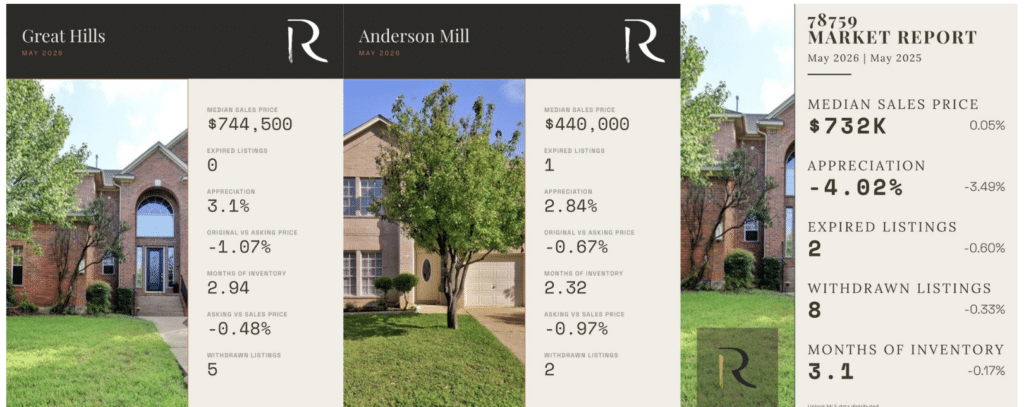
Great Hills and Anderson Mill posted gains of 3.1% and 2.84%, respectively
These areas demonstrate stronger-than-average resilience and recovery potential.
What This Means for Buyers and Sellers
For buyers: Acting sooner may provide a strategic advantage. Entering the market before inventory tightens further allows for more choices and better negotiating leverage. As supply continues to shrink, competition is likely to intensify.
For sellers: This could be an optimal listing window, especially if your property is located in a low-inventory, high-demand neighborhood. However, pricing strategy is critical. Overpricing in today’s market can backfire, while a well-positioned price can attract multiple offers and accelerate the sale.
If you’d like access to the full dataset covering the Austin metro and key communities, feel free to reach out.