

Austin’s July Housing Market Trends: CPI, Soft-Landing , and Supply Chain Stabilization
Austin CPI Data
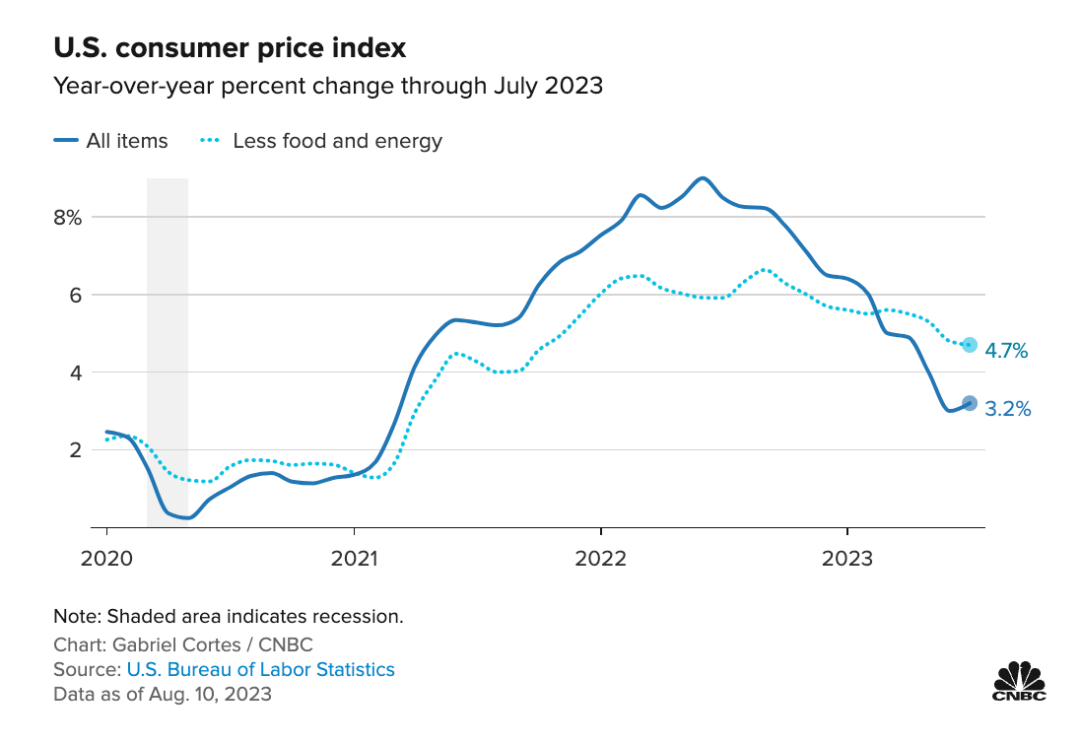
The consumer index (CPI) rose lower than expected in July and continued to decline . The core CPI was 4.7% , down 0.1% month-on-month. The Fed has raised interest rates 11 times in a row this year to fight inflation, bringing the rate to 3% – one step closer to its 2% target – suggesting we are on the right track for a soft-landing. The job market – a major indicator of a soft-landing – remains healthily growing. Retail sales and wages grow, and GDP has remained positive since the two-quarter slump in 2022.
July house price data report
According to a market report released by the Austin Board of REALTORS® in Austin, the number of home sales in the greater Austin-Round Rock metropolitan area (Austin-Round Rock) in July increased by 0.6% year-over-year to 2,815 units. Considering that the fiery spring and summer are coming to an end , the July data shows that the market is gradually stabilizing . Pending Sales increased by 14.5% (2,892 units) year-on-year, and it is expected that there will be a strong ending in the next quarter.
Stable interest rates are a good time for potential buyers, especially those in school districts. Working with an experienced real estate agent can help buyers make quick and confident decisions at this time.
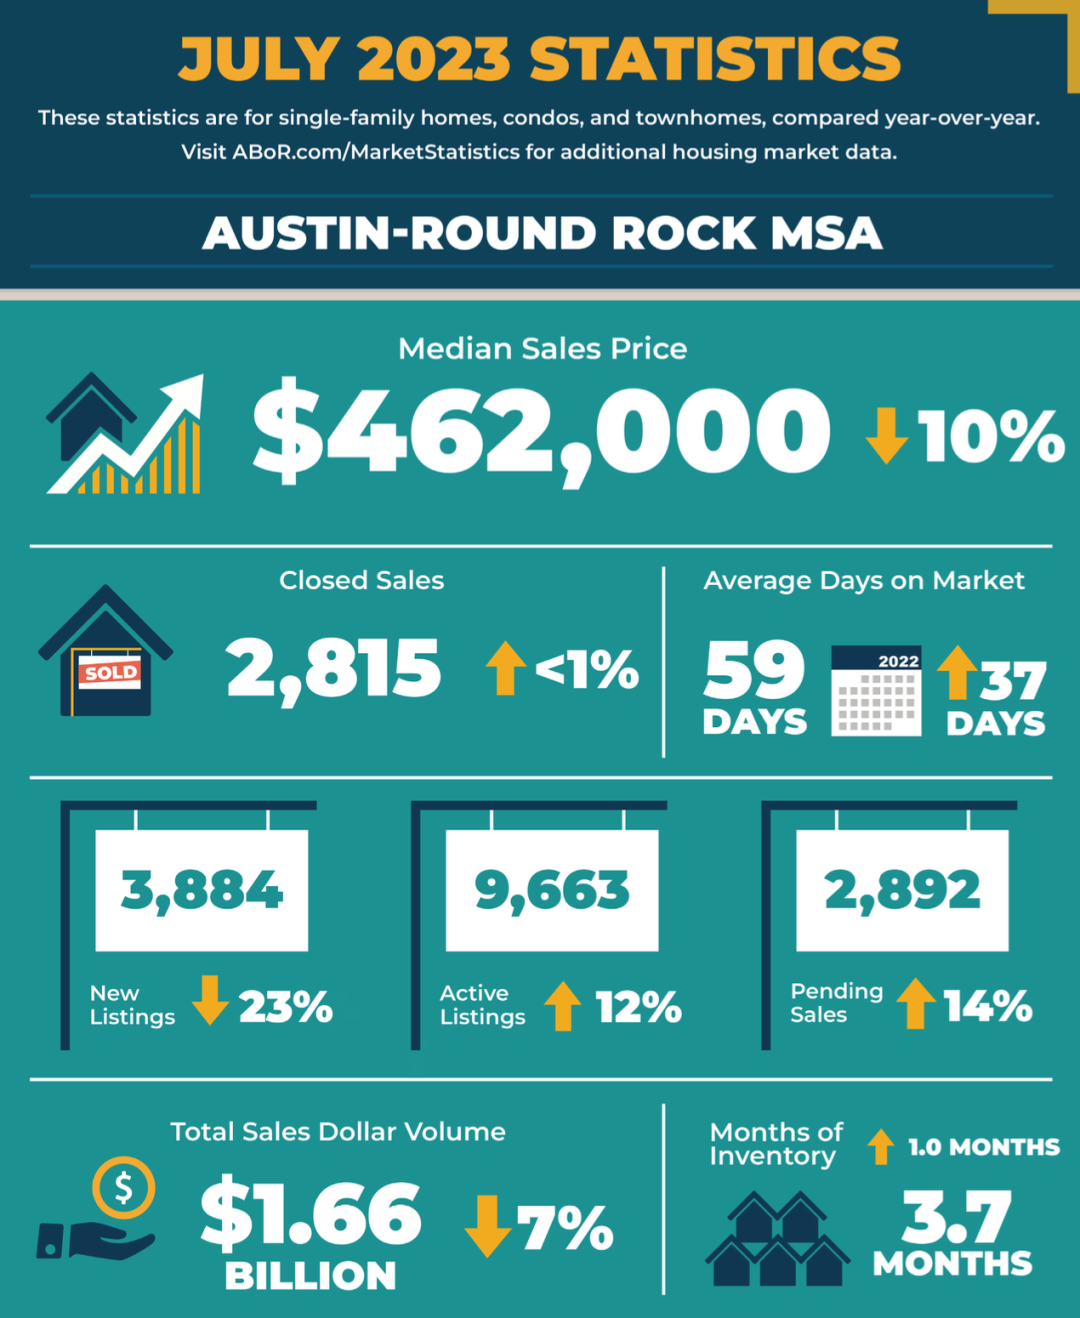
Total sales in the Austin metro area decreased by 7.2% with an average time to market of 59 days. The median home price dropped by 10.3% to $462,000, while new listings decreased by 23.7% to 3,884 listings. However, active listings saw a 12.8% increase to 9,663, and housing inventory stood at 3.7 months.
City of Austin:
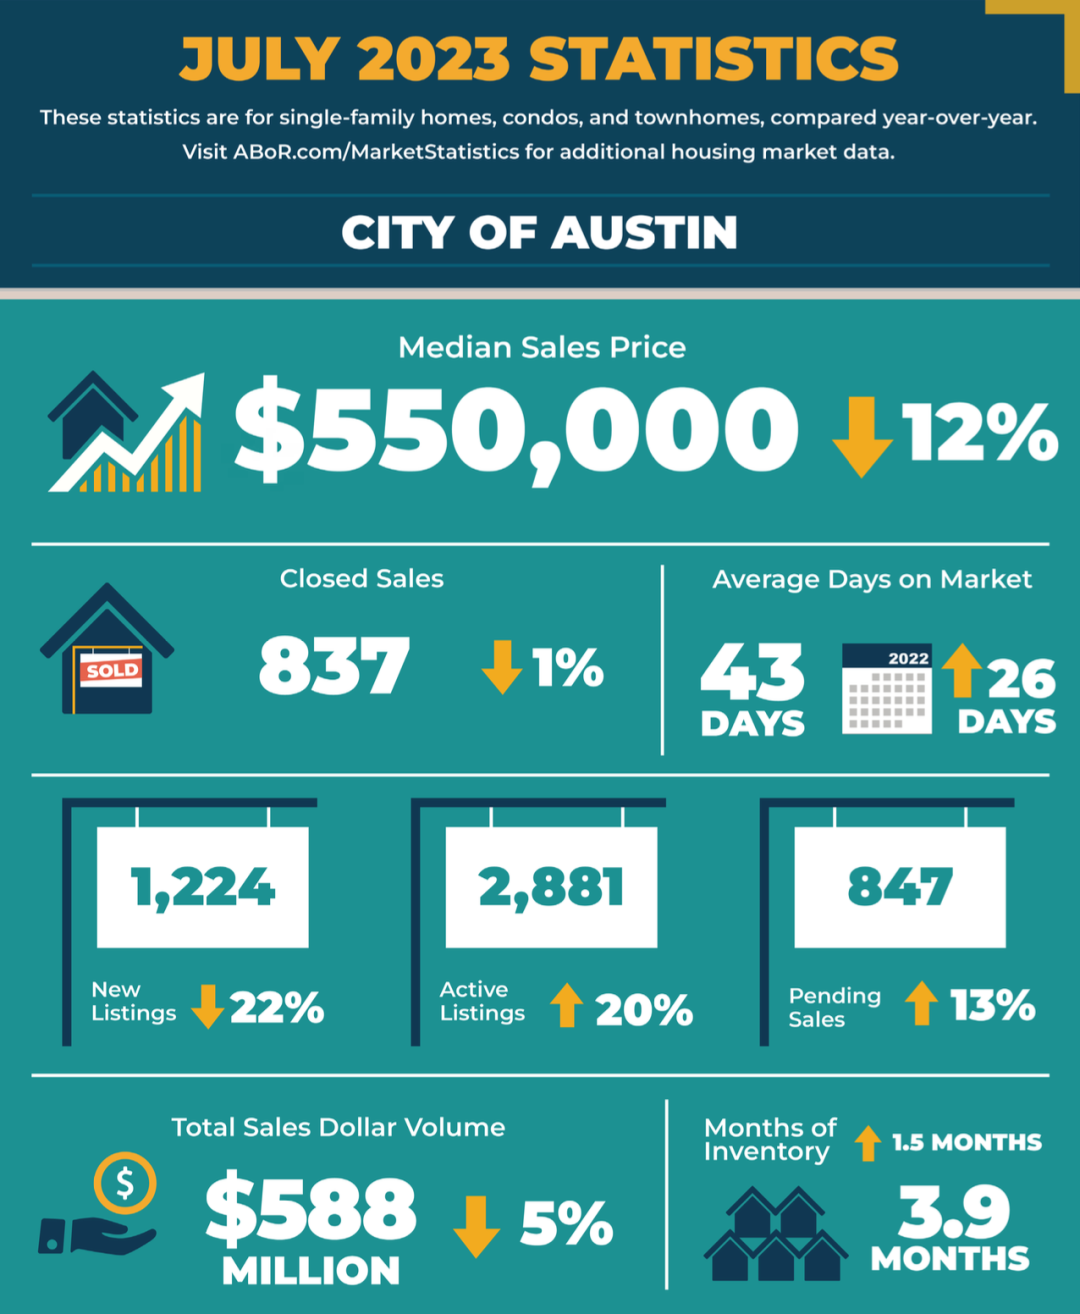
The median home price in downtown Austin declined by 12% YoY to $550,000 in July. There were 837 transactions, similar to last year, and 1,224 new listings, down by 22.6% YoY. Active listings increased by 20.0% YoY to 2,881, and pending sales rose by 13.2% YoY to 847. Housing inventory was at 3.9 months, and sales totaled $588 million, down 5.4% YoY.
Travis County:
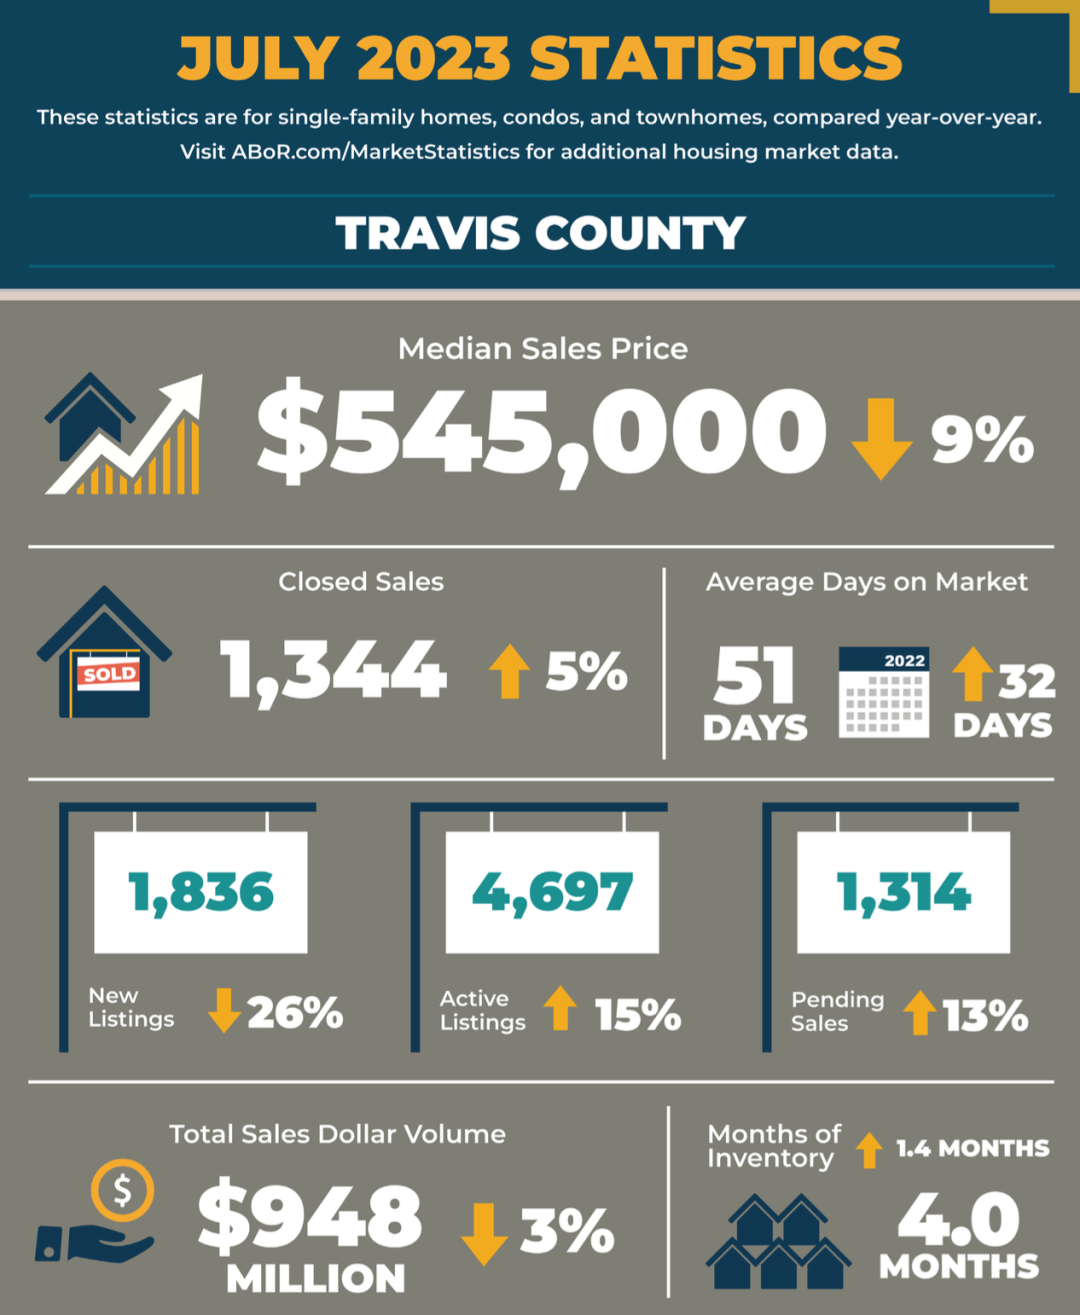
The median house price in Travis County fell by 9.2% YoY to $545,000 in July. Deeded homes increased by 5.5% YoY to 1,344. New listings decreased by 26.7% YoY to 1,836. Pending sales increased by 13.7% YoY to 1,314. Inventory stood at 4.0 months, and sales totaled $948 million, a 3% YoY decrease.
Williamson County:
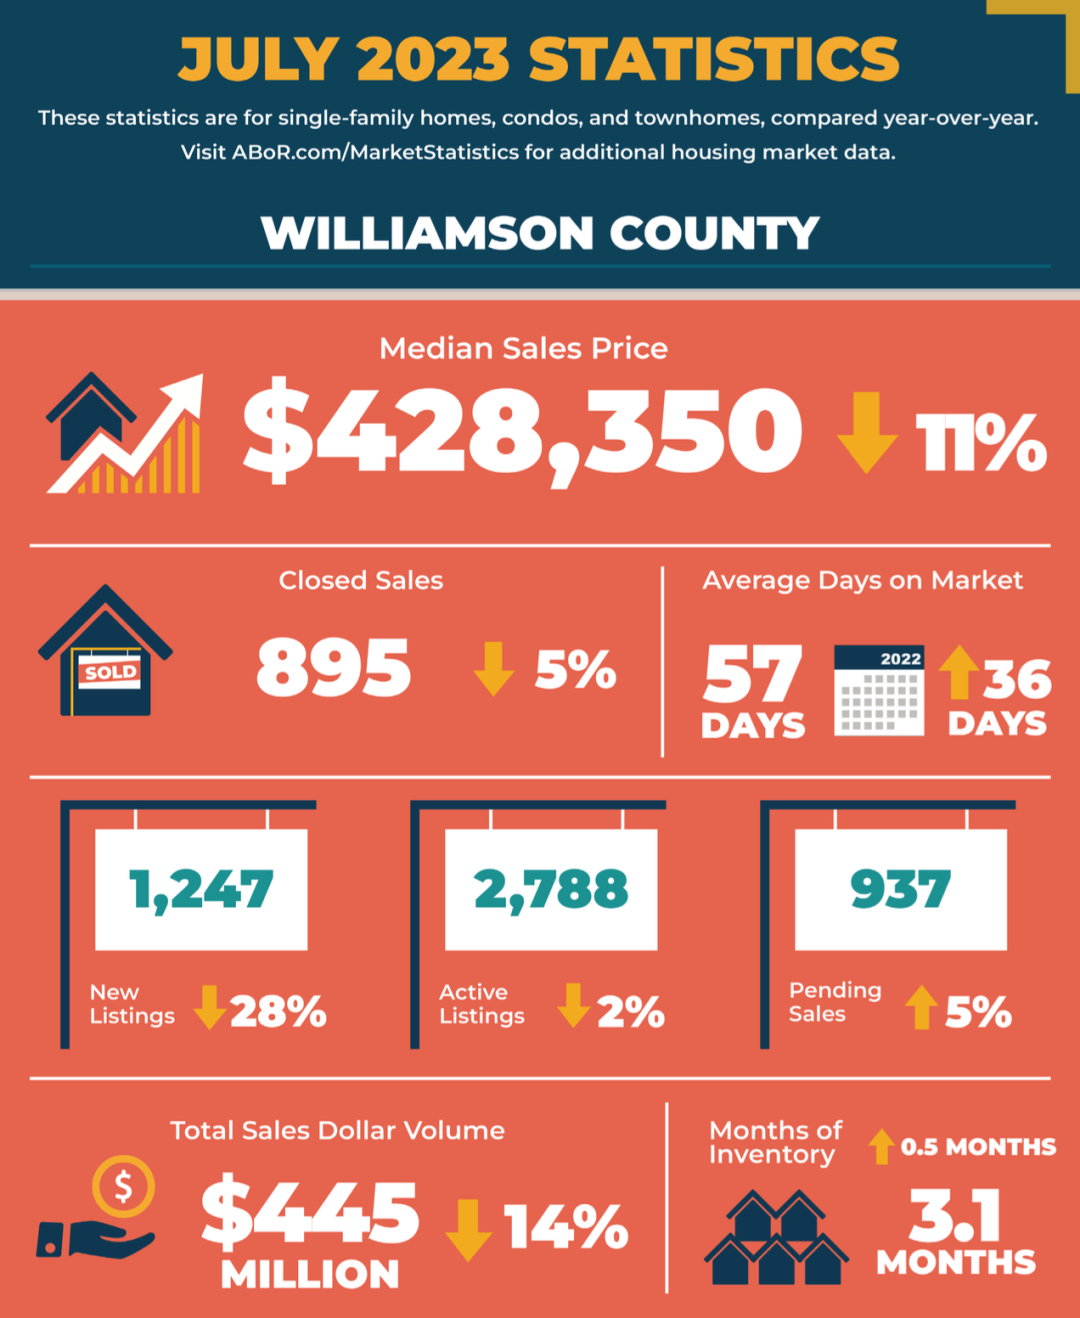
The median home price in Williamson County dropped by 11.7% YoY to $428,350 in July. Transactions and transfers decreased by 5.4% YoY to 895. New listings fell by 28.1% YoY to 1,247. Active listings decreased by 2.1% from the previous year to 2,788. Pending sales increased by 5.6% YoY to 937. Inventory stood at 3.1 months, and sales totaled $445 million, down 14.5% YoY.
Bastrop County:
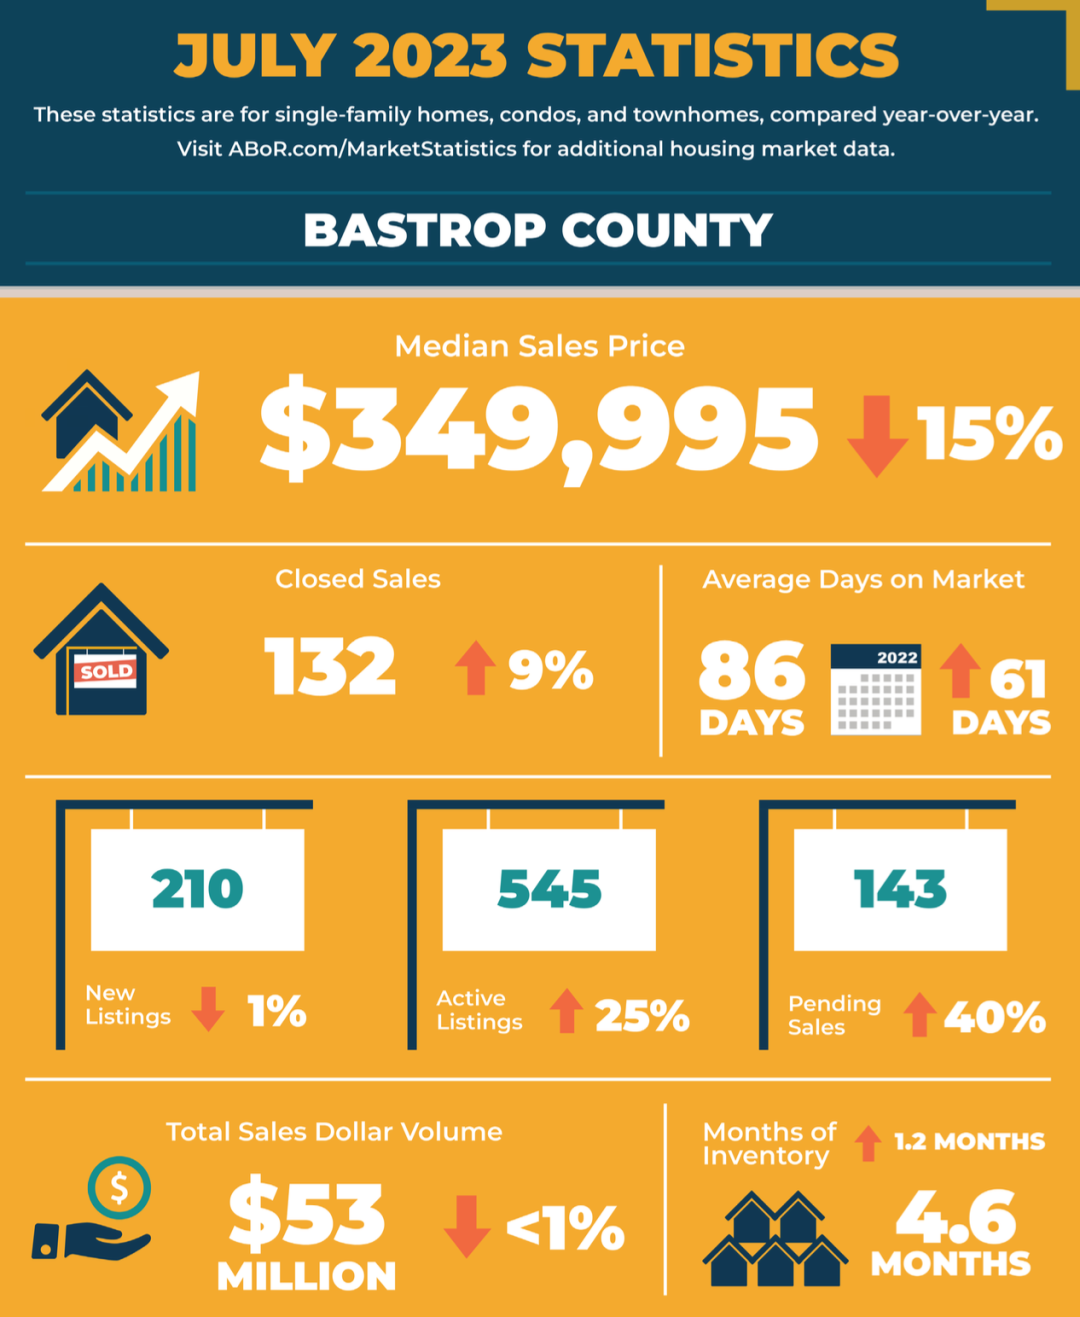
The median home price in Bastrop County was $349,995 in July, showing a 15% YoY decline. Completed transactions increased by 9% YoY to 132. Newly listed listings were 210, and active listings increased by 25% YoY to 545. Pending sales increased by 40% YoY to 143. Total sales volume was $53 million, comparable to last year.
Hays County:
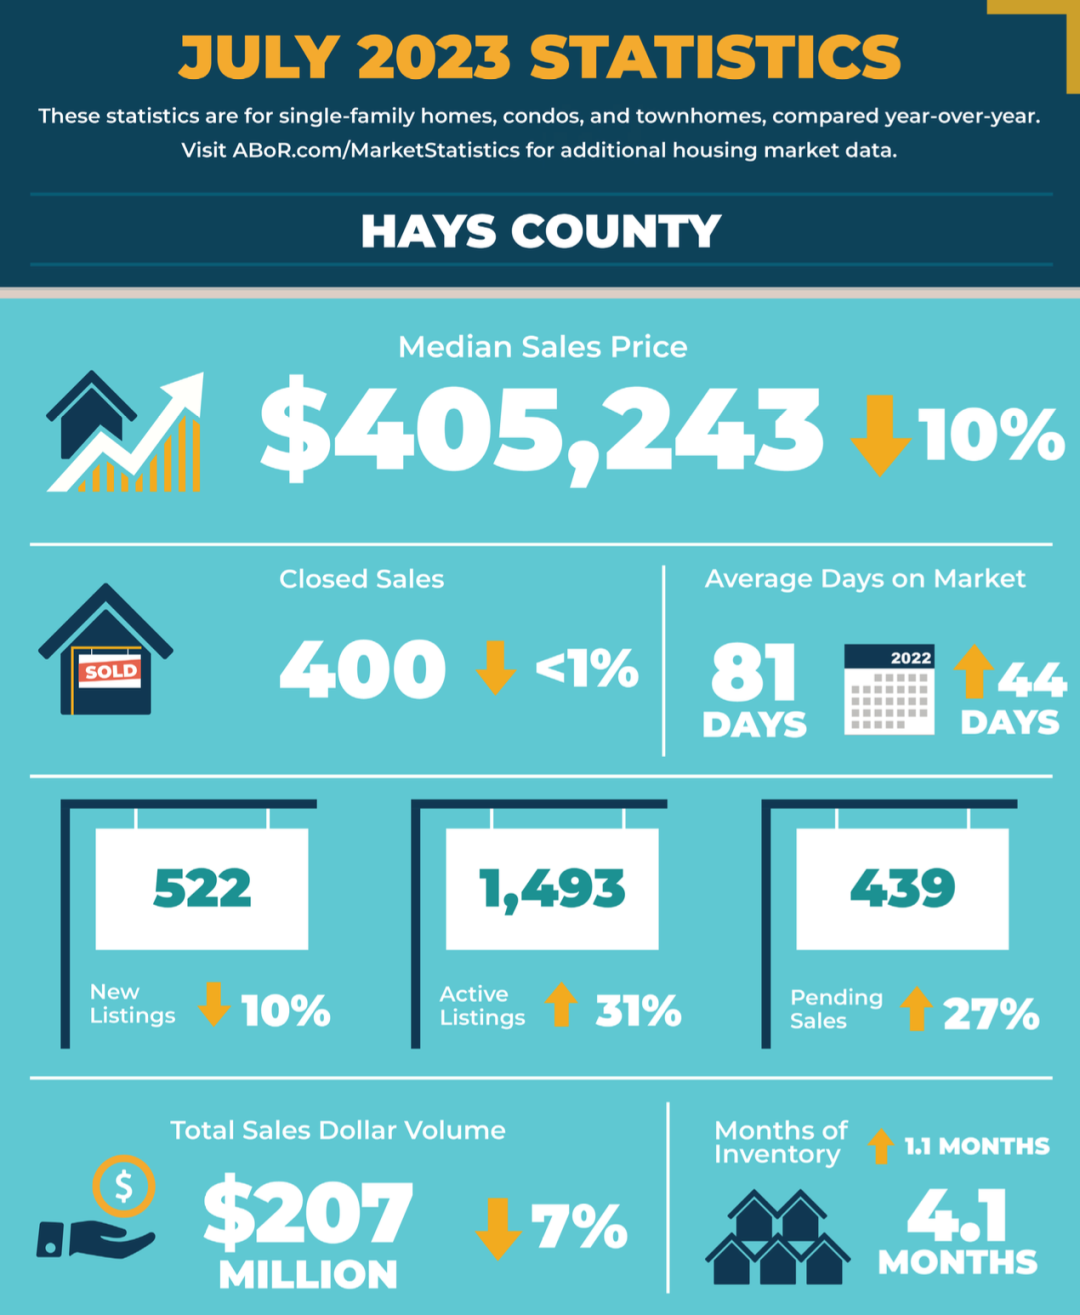
The median home price in Hays County was $405,243 in July, down by 10% YoY. Transactions and transfers remained stable. New listings decreased by 10% YoY to 522. Pending sales increased by 27% YoY to 439.
Caldwell County:
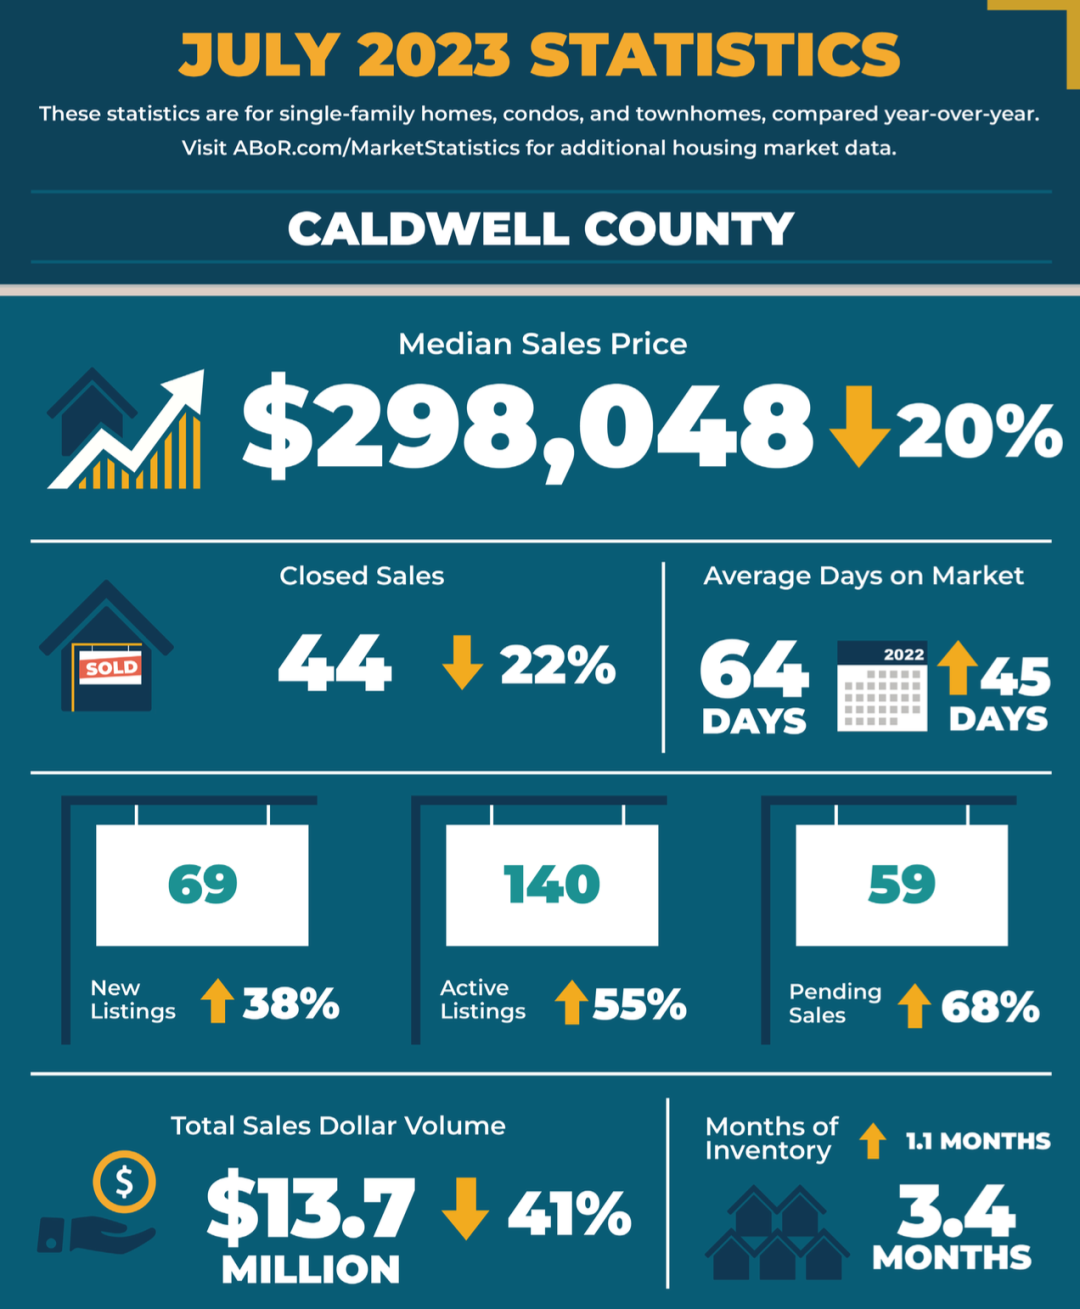
The median house price in Caldwell County for July was $298,048. There were 69 newly listed listings, 44 completed transaction transfers, and 59 entering Pending Sales, marking a 68% YoY increase.
Overall, Austin can be observed to be in a short-term contraction. However, indicators are appearing suggesting that demand and supply are once again shifting away from the buyer’s market we have been seeing: new listings (supply) falling, and sales increasing, in almost every locality of the Austin metro.
